Get Actionable Insights That Your Stakeholders Want
At RVS Softek, we elevate your Jira experience with powerful visualizations.
- Fully Customizable Charts: Adjust axes, titles, legends, and data series easily.
- Built for Your Team: Align and style charts to match your dashboard needs.
- Real-Time Data: Auto-refresh charts at set intervals.
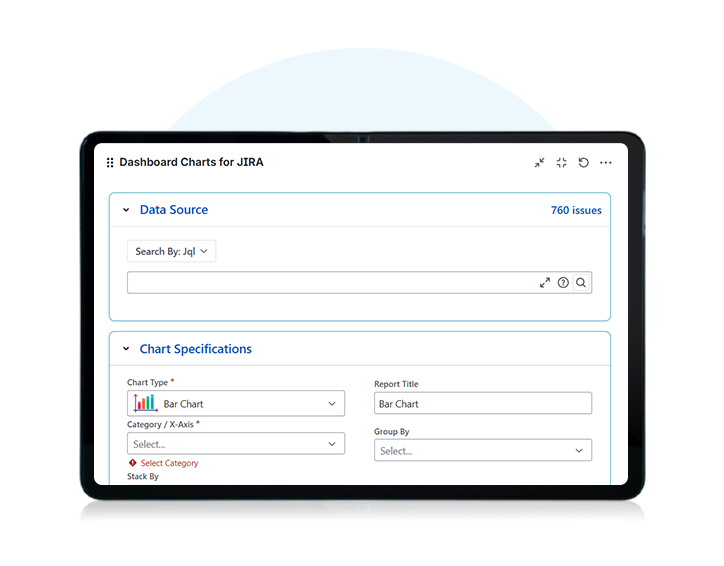
- Easy Jira Setup: Add the gadget to your dashboard in minutes.
Trusted by Over 2000+ Teams Worldwide to Optimize Jira Workflows
Powerful Features for Dynamic Jira Data Visualizations
Transform your Jira data into clear, actionable insights with customizable charts and real-time visualizations.
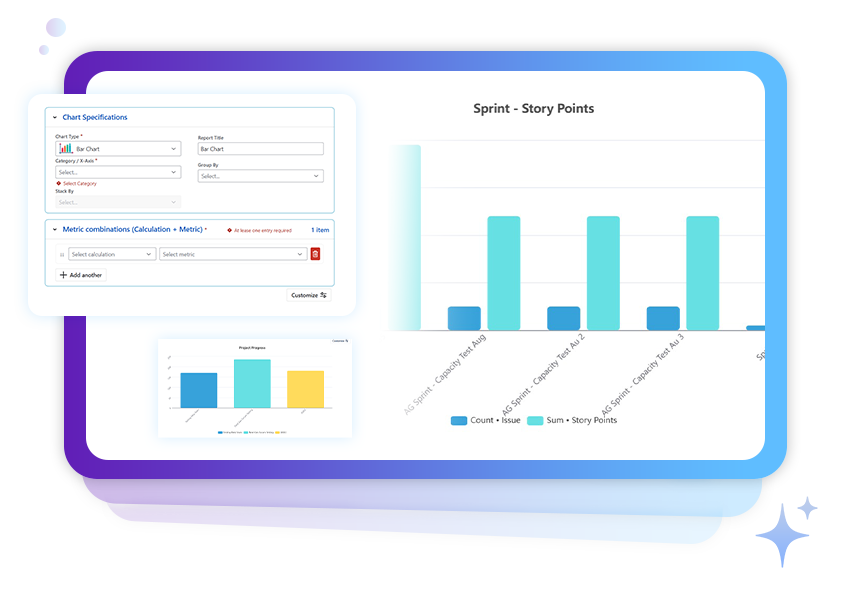
 Custom Jira Dashboards & Charts
Take control of your Jira project reports with fully customizable dashboards and charts for real-time project insights.
 Advanced Jira Reporting Tool
Simplify and track project performance effortlessly with powerful Jira project reports.
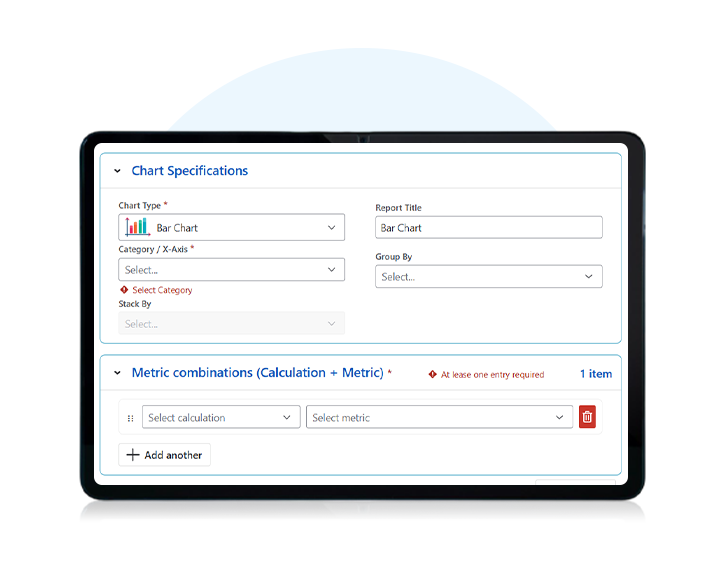
 Data-Driven Sprint Tracking
Unlock the potential of your Jira data with custom chart gadgets to enhance sprint tracking.
 Combine
multiple Jira dashboard metrics for complex, multi-dimensional reports
Combine
multiple Jira dashboard metrics for complex, multi-dimensional reports
- Build
dynamic, tailored charts to visualize key metrics
- Gain
instant visibility into team workloads and issue progress
- Create
pie, bar, and trend analysis charts
- Share
real-time insights with your team and stakeholders
- Stay
aligned and ahead of deadlines with actionable data
.
- Track
sprint progress and identify bottlenecks
- Streamline
workflows with data-driven insights
- Optimize
project delivery by taking actionable steps
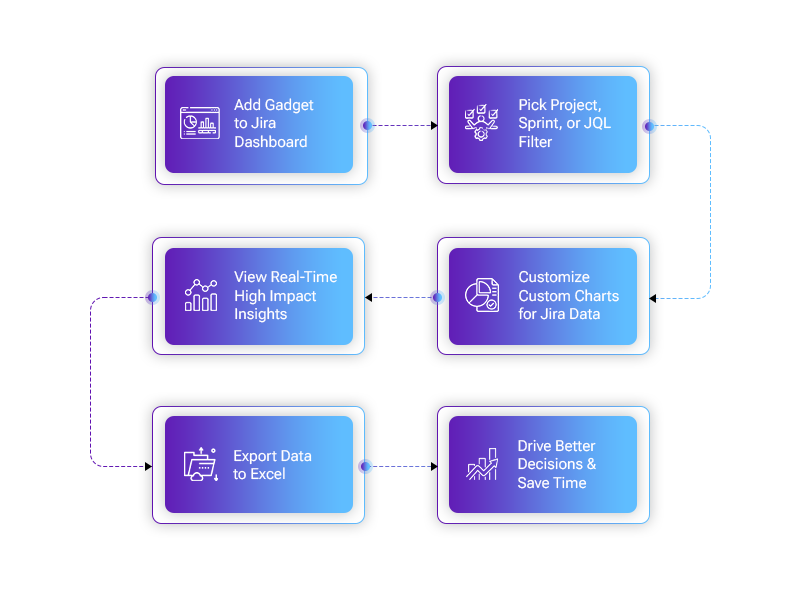
How does it work?
Why RVS Softek?
Effortless Time Tracking
RVS Softek’s Agile Tools simplifies time tracking with customizable views and automatic logging. Minimize manual entries and enhance productivity through efficient time management.

Real-Time Visibility
Gain real-time insights into task progress and team performance with customizable reports and dashboards. Make data-driven decisions quickly, ensuring faster project delivery and optimized workflows.

Advanced Reporting
Export detailed reports in CSV format for seamless integration with tools like Power BI. Use advanced filtering to analyze time across projects and teams, enabling informed, strategic decisions.

Trusted by Teams across the world
20+
Years of Experience
6000+
Happy Clients
17
App
90+
Reviews

What Our Customers Say

Franco Martin

"Perfect for my needs—shows exactly how many days issues spend in each status and much more. Their customer service is also amazing! So quick and so helpful. Excellent app!"

Richard Brand
"The Time in Status Reports app is a great tool for tracking the time tasks spend in different statuses. The interface is user-friendly, and the reports provide valuable insights into workflow efficiency."

Giju V
"This is a very useful app for us to identify the waiting time of tickets in each status and also helps the number of times the transitions happened for each ticket."
Pricing That’s As Easy As It Gets—Completely Free!
At RVS Softek, we believe in making powerful tools accessible. That’s why Dashboard Charts for Jira is completely free, allowing your team to start visualizing Jira data without any barriers.
- Full Access to Customizable Charts—Create detailed reports and visualizations without any limitations.
- Seamless Jira Integration—Integrate directly into your existing Jira setup, no extra setup required.
- Instant Insights—Get real-time updates and visualize project data in seconds.
Start using Dashboard Charts for Jira today and take your Jira reporting to the next level, completely free of charge!

Frequently Asked Questions
With the Dashboard Charts for Jira plugin, you can easily create Jira custom reports by selecting multiple metrics and customizing the charts to visualize your team's performance and progress.
This plugin allows you to generate various Jira software reports, including bar charts, pie charts, and trend analysis, giving you clear insights into your project's status and team performance.
Jira sprint reports provide valuable insights into sprint performance, helping you monitor how much work is completed, identify bottlenecks, and optimize sprint planning.
Yes, the Jira reporting dashboard feature allows you to view live data directly on your dashboard, offering real-time visibility into project metrics and team progress.
The custom chart for Jira feature lets you design personalized charts by selecting the relevant metrics, enabling you to create multi-dimensional reports tailored to your specific project needs.
Yes, you can customize charts in Jira to focus on specific metrics, making it easy to track progress, workloads, and performance across different teams.
The Jira reporting tool provides actionable insights through customizable charts and reports, allowing you to make data-driven decisions and optimize your project management processes.
Ready to Optimize Your Time Tracking?
Silver Marketplace Partner

Stop wasting time and start tracking smarter! Streamline time logging, generate insightful Jira time tracking reports, and boost your team's productivity with RVS Softek's Agile Tools.
Contact us today for more details.