
Sprint Reviews: Jira Dashboards or Spreadsheets?
Compare Jira reporting dashboard tools with spreadsheets for sprint reviews. See which option gives agile teams clearer, faster insights and better decisions.
Published
Oct 5, 2026
Topic
Reports
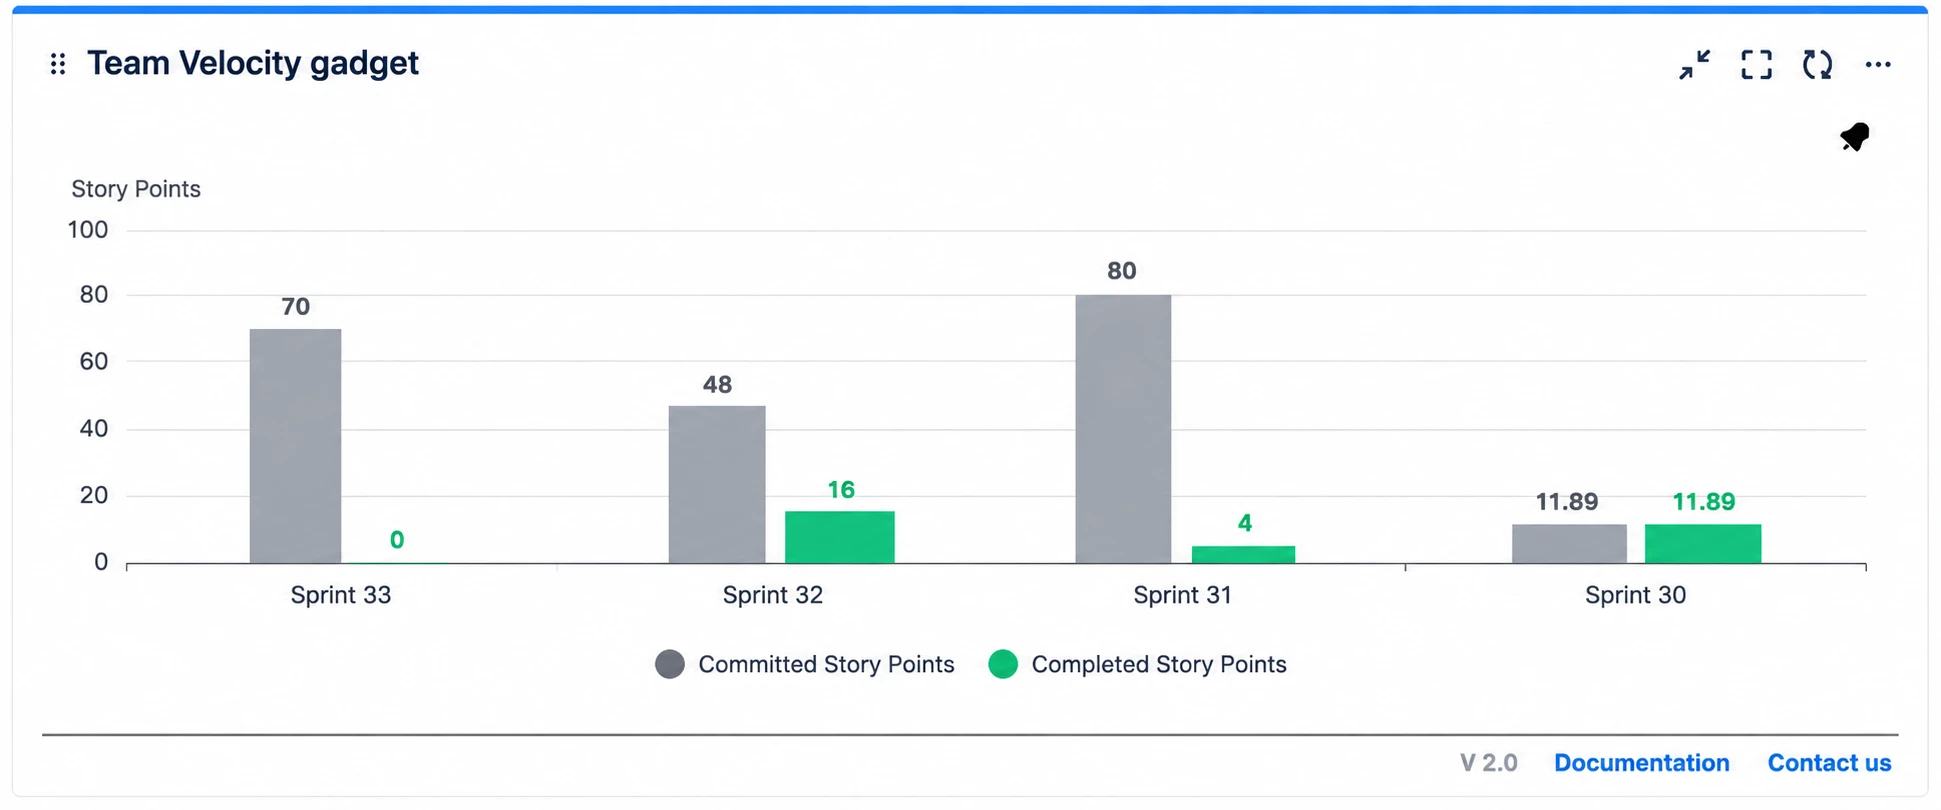
Turn Sprint Reviews Into Faster Team Decisions
Sprint reviews work best when they help your team make decisions, not when they become a long status update. You need a clear view of what was finished, what moved forward, what got stuck and what needs attention next. When that evidence is easy to trust, you can spend more of the meeting talking about outcomes instead of debating numbers.
At RVS Softek, we often see teams preparing for reviews by exporting Jira issues into spreadsheets, then cleaning columns and rebuilding charts shortly before the meeting. Spreadsheets can be useful, but Jira reporting dashboard tools give you a more current and connected picture when decisions need to happen quickly. Below, we compare data accuracy, reporting effort, stakeholder visibility, governance and what to look for in a reporting solution.
Why Spreadsheets Slow Down Sprint Evidence
A spreadsheet usually begins with a Jira export, but the work rarely ends there. Someone needs to sort issues, remove unwanted fields, check story points, update formulas and create charts that make sense to everyone in the room. This may feel manageable for one small board, yet it gets harder when several squads, projects or time zones are involved.
The real problem is timing. Jira work can change after the export. An issue may be reopened, moved to another status, adjusted in size or added to the sprint late. By the time the review starts, a carefully prepared spreadsheet may already be out of date.
Different report owners can also interpret metrics in different ways. One person may count completed work based on a final workflow status, while another may include items waiting for review. That makes it harder for stakeholders to compare sprints fairly.
Static files also limit useful discussion. When someone asks why work carried over, they may not be able to open the linked Jira issue, inspect the filter or see the sprint details behind a chart. The meeting then fills with follow-up questions that a connected report could answer more quickly.
How Jira Reporting Dashboard Tools Improve Reviews
Jira reporting dashboard tools bring live sprint information into one shared view. Rather than recreating the same report every sprint, we can configure dashboards to surface the signals your team needs for a meaningful review.
Useful sprint review views often include:
- Planned work compared with completed work
- Sprint progress and burndown trends
- Blocked, reopened or unresolved issues
- Carry-over items and their likely causes
- Velocity patterns across recent sprints
Because the reporting is linked to Jira data, you can move from a high-level chart into the related issues and filters. That makes the conversation more grounded. Instead of asking whether a total is correct, your team can look at the work behind it and decide what should happen next.
Dashboards also let us tailor the view for different audiences. Delivery teams may want issue-level detail, workflow status and blocker information. Product leaders may care more about sprint goal progress, delivery predictability and release readiness. Stakeholders often need a simple view of outcomes, risks and dependencies. A well-planned dashboard does not force every person to read the same dense report.
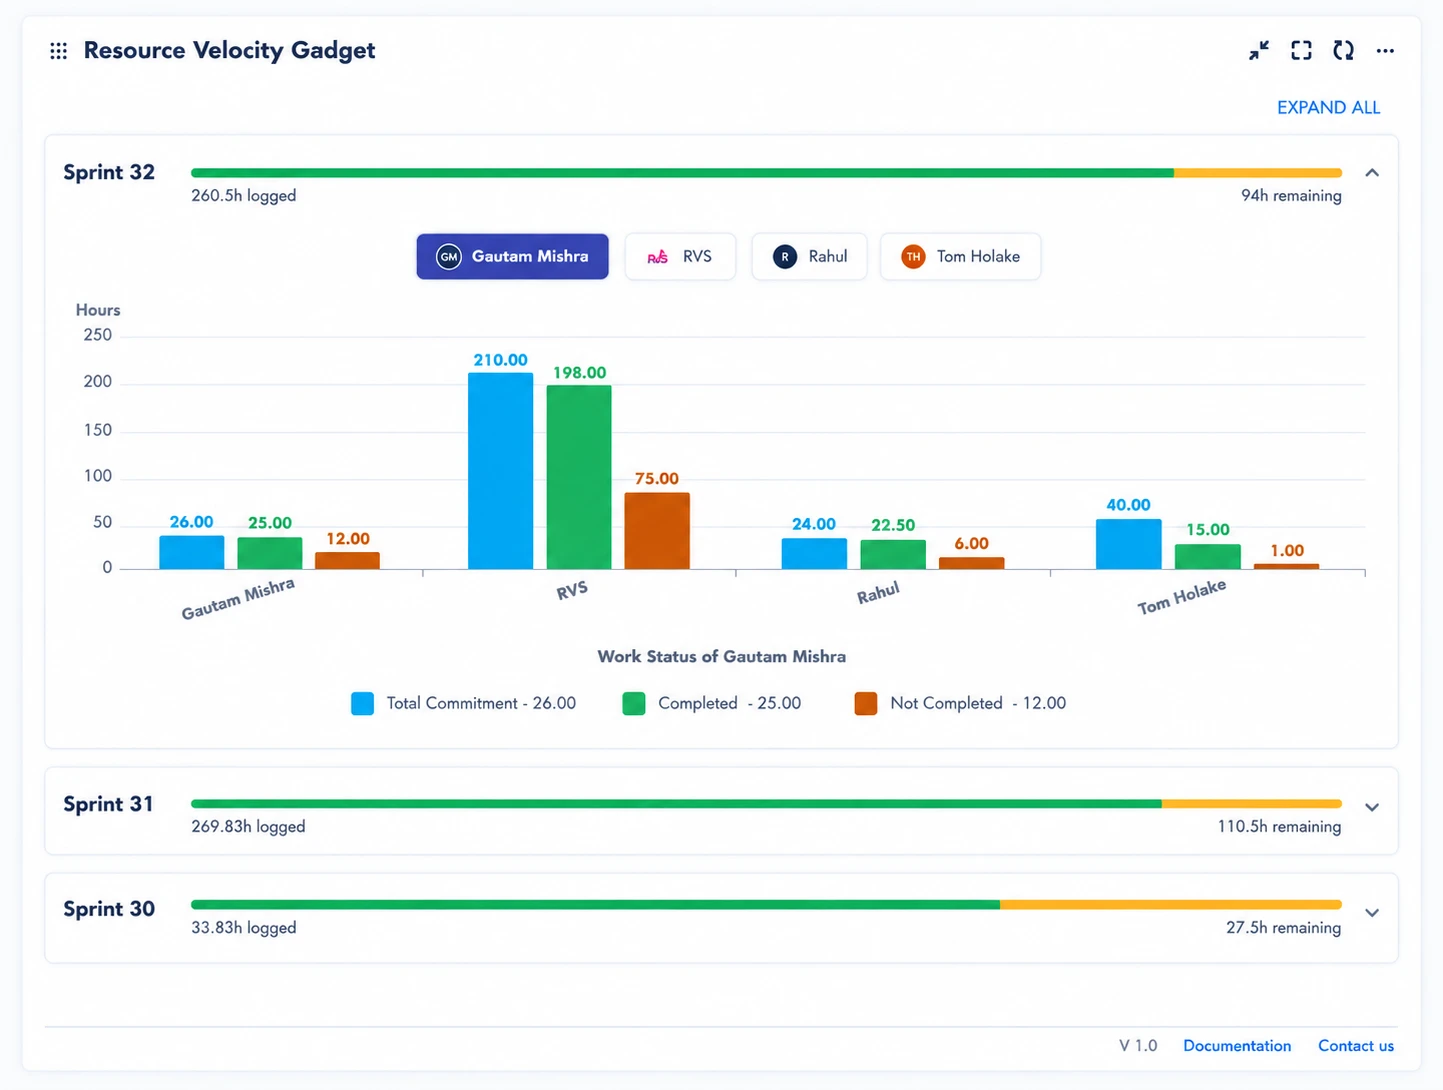
The biggest benefit is action. When you can see why work carried over, where capacity was stretched or whether scope changed during the sprint, the review becomes a place to improve planning and prioritisation.
Compare Visibility, Governance and Reporting Effort
Spreadsheets and dashboards are not enemies. We still see value in spreadsheets for one-off analysis, offline modelling or bringing together information from sources beyond Jira. They can be flexible when you are testing an idea or answering a very specific question.
For recurring sprint reviews, though, dashboards usually create a cleaner reporting habit. Here is how the two approaches compare:
| Factor | Spreadsheets | Jira Dashboards |
|---|---|---|
| Data freshness | Manual export | Connected to Jira |
| Traceability | Limited | Links to Jira issues/filters |
| Reporting effort | Manual | Reusable |
| Collaboration | File-based | Shared dashboard |
| Scalability | Becomes harder to maintain | Better for multiple teams |
Good governance is not about making reports harder to access. It is about helping everyone work from the same definitions. Agree what "done" means, decide how to treat reopened work and make sprint scope changes visible. Once those rules are clear, your reporting becomes more useful and less open to confusion.
Choose Jira Reporting Dashboard Tools That Fit
Before comparing features, we recommend starting with the decisions you need your sprint review to support. Do you need to confirm whether the sprint goal was met? Understand why work carried over? Review team capacity? Highlight cross-project dependencies? The best dashboard is the one that makes those questions easier to answer.
As you assess Jira reporting dashboard tools, consider whether they provide:
- Compatibility with your Jira setup and existing workflows
- Configurable gadgets, filters and views for different audiences
- Timely data refreshes that reflect current sprint activity
- Cross-project reporting where teams work across several boards
- Permission controls and clear sharing options for stakeholders
Visual clarity matters too. A report overloaded with charts can hide the story rather than explain it. We recommend choosing a small group of measures that match your sprint goals, then giving each metric a clear purpose. If a chart does not lead to a useful question or decision, it may not need to be on the dashboard.
Organisations using Jira can also explore Atlassian Marketplace apps from experienced partners such as RVS Softek. Our apps support agile performance tracking, capacity planning, team collaboration and visual communication across Jira, Confluence and monday.com.
Build Better Sprint Reviews Before Year-End Planning
October is a sensible time to review how your sprint reviews are working. Holiday availability changes, annual roadmap conversations and next-year capacity planning can all place more pressure on delivery teams. A reporting process that depends on last-minute spreadsheet updates can become an unnecessary drain when planning work is already busy.
Before your next review, look at the latest sprint report and ask three simple questions: How much time did we spend preparing it? How often did the data change after export? Could stakeholders trace each metric back to the Jira work behind it? Spreadsheets remain helpful for occasional analysis, but live dashboards are usually the stronger choice for recurring reviews that need timely, reliable and shareable evidence.
Make Sprint Reviews Easier to Act On
At RVS Softek, we help teams turn sprint data into clear, decision-ready reporting without unnecessary manual effort. Our Jira reporting dashboard tools can give your stakeholders a shared, up-to-date view of delivery progress and team performance. If you would like to discuss the right reporting approach for your workflows, contact us to speak with our team.
Frequently asked questions
Are Jira dashboards better than spreadsheets for sprint reviews?
For teams already using Jira, Jira dashboards are often more efficient because they report directly from Jira data without manual spreadsheet updates.
Can Jira replace Excel for sprint reporting?
For many teams, yes. Jira can handle recurring sprint reporting directly from project data, while Excel is better suited to custom calculations and analysis.
What is the best way to report sprint performance in Jira?
A Jira dashboard is one of the easiest ways to monitor sprint performance, with metrics such as velocity, sprint progress, completed work, and remaining work.
What should a Jira sprint dashboard include?
A useful sprint dashboard should show the metrics a team needs to review progress, such as velocity, issue status, completed work, remaining work, workload, and blockers.
Why use a Jira dashboard instead of a spreadsheet?
Jira dashboards keep reporting connected to Jira data, reduce manual updates, and give teams a shared view of sprint and project performance.
What is the best Jira reporting dashboard tool?
The right Jira reporting tool depends on the team's reporting needs, but it should provide accurate Jira data, useful visualizations, flexible dashboards, and minimal manual reporting work.
Written by the team building RVS Softek's apps for Jira and Confluence.
Ask us a questionMore from the blog
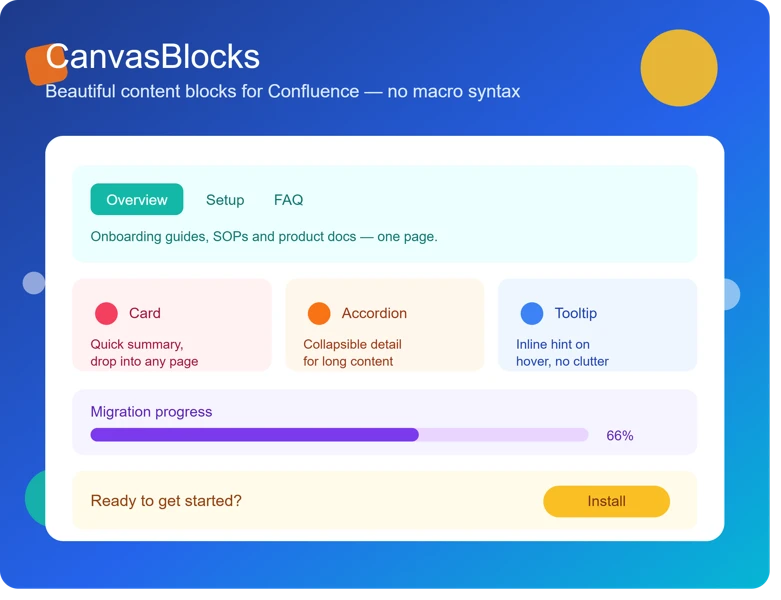
5 Signs Your Confluence Content Needs Formatting Upgrades
Discover the warning signs that signal your team needs Confluence page formatting apps to create clearer, more consistent, and engaging documentation.
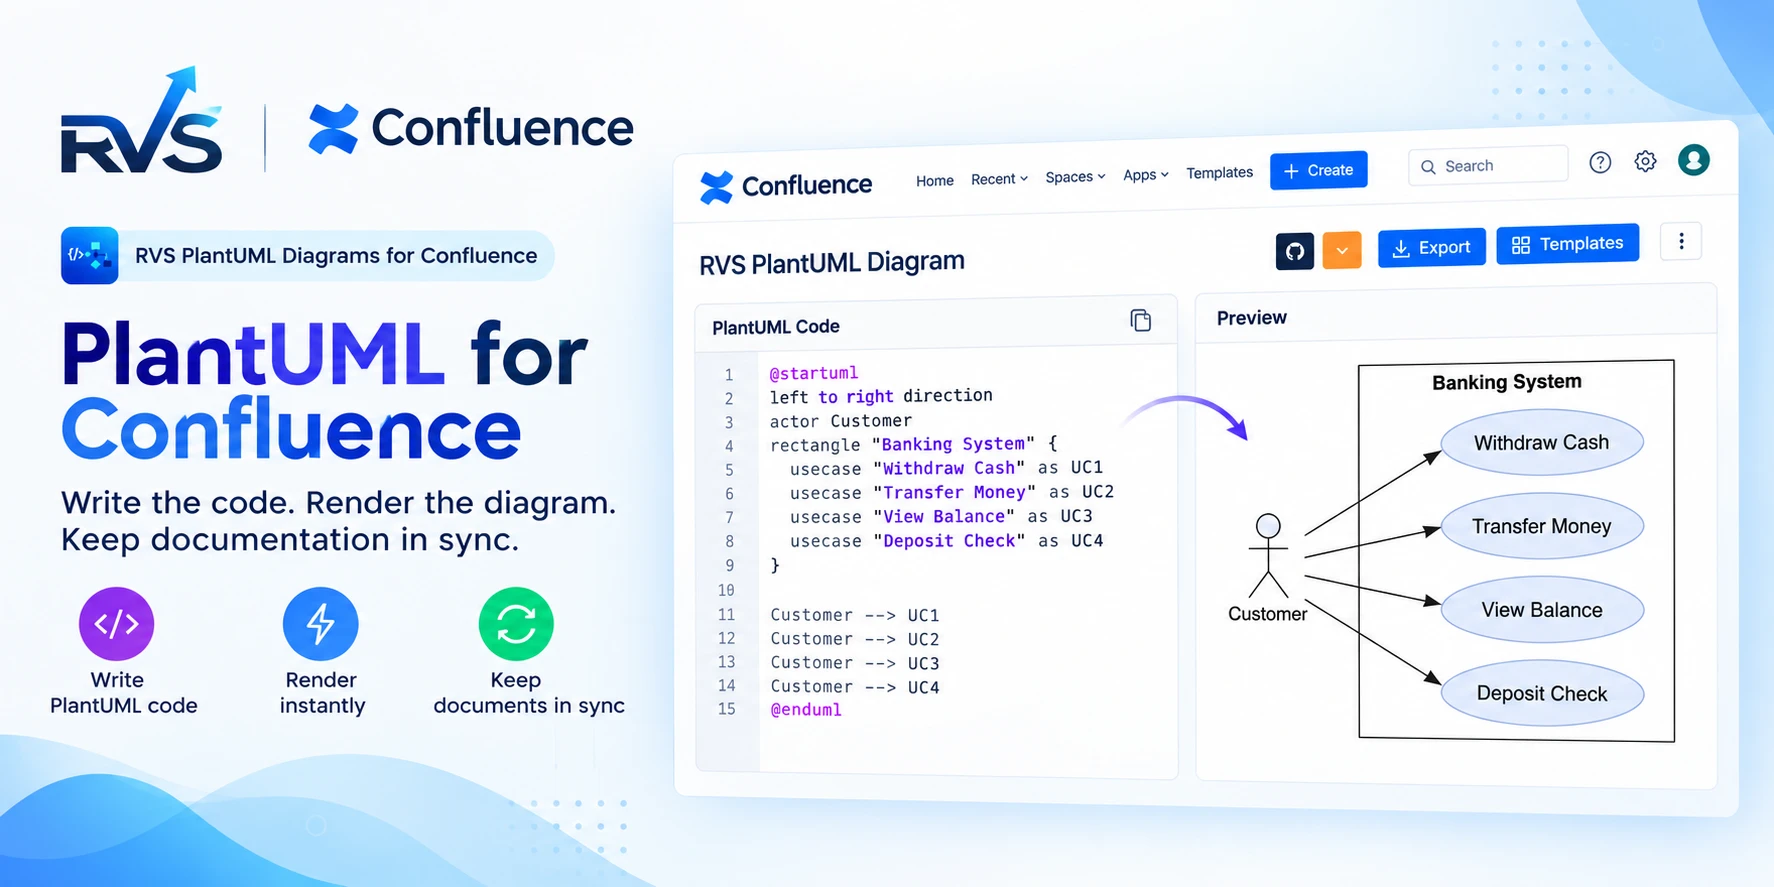
PlantUML for Confluence: RVS vs Stratus
Compare RVS and Stratus PlantUML apps for Confluence: Git integrations, templates, diagram types, Cloud vs Data Center support, and migration.
Improve Sprint Delivery With Jira Capacity Planning
Learn why sprint commitments fall short and how Jira capacity management software helps teams balance workloads, plan realistically, and deliver reliably.
Find the RVS Softek app your team needs
Browse the catalogue for Jira, Confluence and monday.com — or install straight from the Atlassian Marketplace and start a free trial in minutes.
- Free trial on every paid app
- Runs on Atlassian
- Support in one business day

16 apps · 1,873+ installs · Runs on Atlassian