
Plan Releases with Sprint Velocity Analytics Tools
Stop guessing release dates. Learn how to turn completed sprint data into a clear velocity baseline, test scope and date scenarios, and keep your release forecast current as capacity changes.
Published
Nov 12, 2026
Topic
Agile
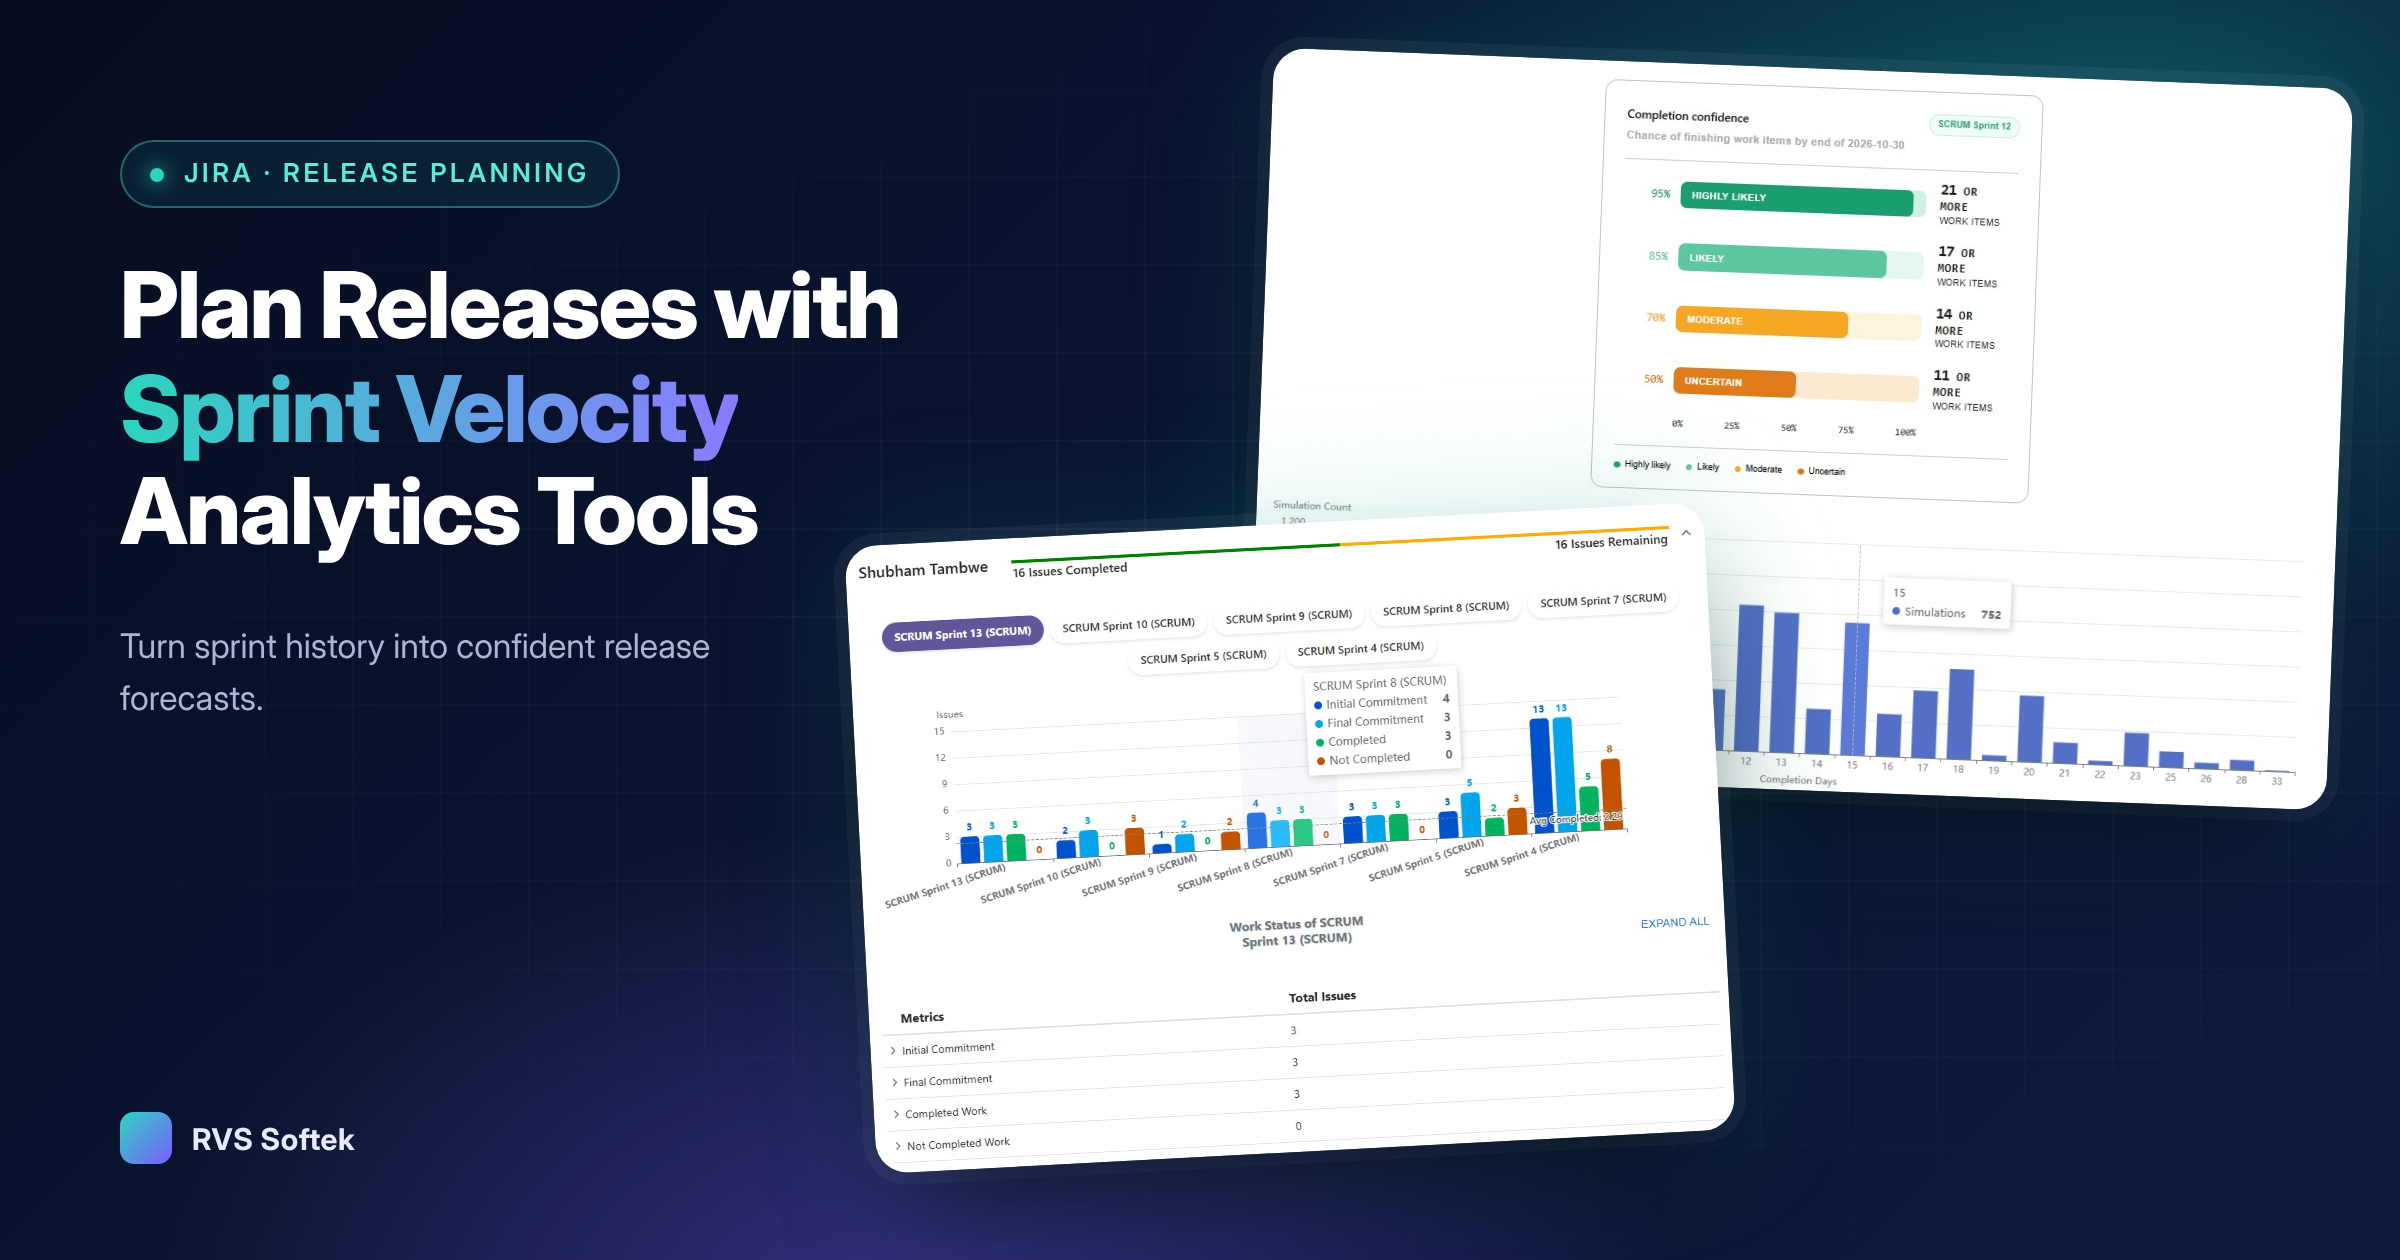
Learn how sprint velocity analytics tools help teams forecast release capacity, spot trends and make more confident delivery plans in Jira with ease When stakeholders ask when a release will be ready, a hopeful date can quickly become a source of pressure. Replace guesswork with a forecast built from completed sprint data, current team capacity and the scope that remains.
Perfect estimates are not required. What matters is having a repeatable way to review what your team has delivered, explain the assumptions behind a release range and update that view as conditions change.
Turn Past Sprints Into Clearer Release Commitments
A release date based on optimism sounds simple, but it often hides important questions. How much work does the team usually finish? Is the team available at its normal level? Has the release scope grown since planning began? An evidence-based forecast makes those questions visible before they become delivery problems.
Sprint velocity is a practical planning signal. It shows the amount of estimated work a stable team has completed within past sprints. It is not a promise that the same amount will be completed forever, and it should never be used as a target that teams are pressured to hit. Instead, we see it as a useful starting point for discussing what is likely.
Forecasting works best as a shared conversation between product, delivery and engineering. Together, you can agree on a realistic delivery range, identify the assumptions behind it and decide what to do if scope or capacity changes. That is far more useful than presenting one fixed date with no room for real-world change.
Build a Trustworthy Velocity Baseline
A single sprint rarely tells the whole story. One sprint may have gone unusually well because a batch of small items was completed, while another may have been disrupted by urgent support work or planned leave. Looking at several completed sprints helps to find a baseline that reflects normal delivery.
For many teams, an average gives a helpful overview. A median can also be useful when one or two sprints sit far above or below the normal pattern. The right choice depends on how variable your delivery has been, but the aim stays the same: use a number that represents typical performance, not an exceptional sprint.
Consistency in estimation matters just as much. Historical velocity is easier to compare when your team uses the same story point scale, sizing approach and definition of done over time. Partly completed work should not be counted as delivered capacity simply because effort was spent on it.
Sprint velocity analytics tools can bring this information into one clear view. Rather than removing inconvenient results, we encourage teams to understand them. Look for reasons such as:
-
Unexpected incidents or urgent support demands
-
Public holidays, leave or reduced availability
-
Large items carrying over between sprints
-
Changes to team membership or competing priorities
Once you understand the pattern, you can decide whether those unusual sprints belong in the baseline or should be treated as exceptions.
Use Sprint Velocity Analytics Tools to Expose Capacity
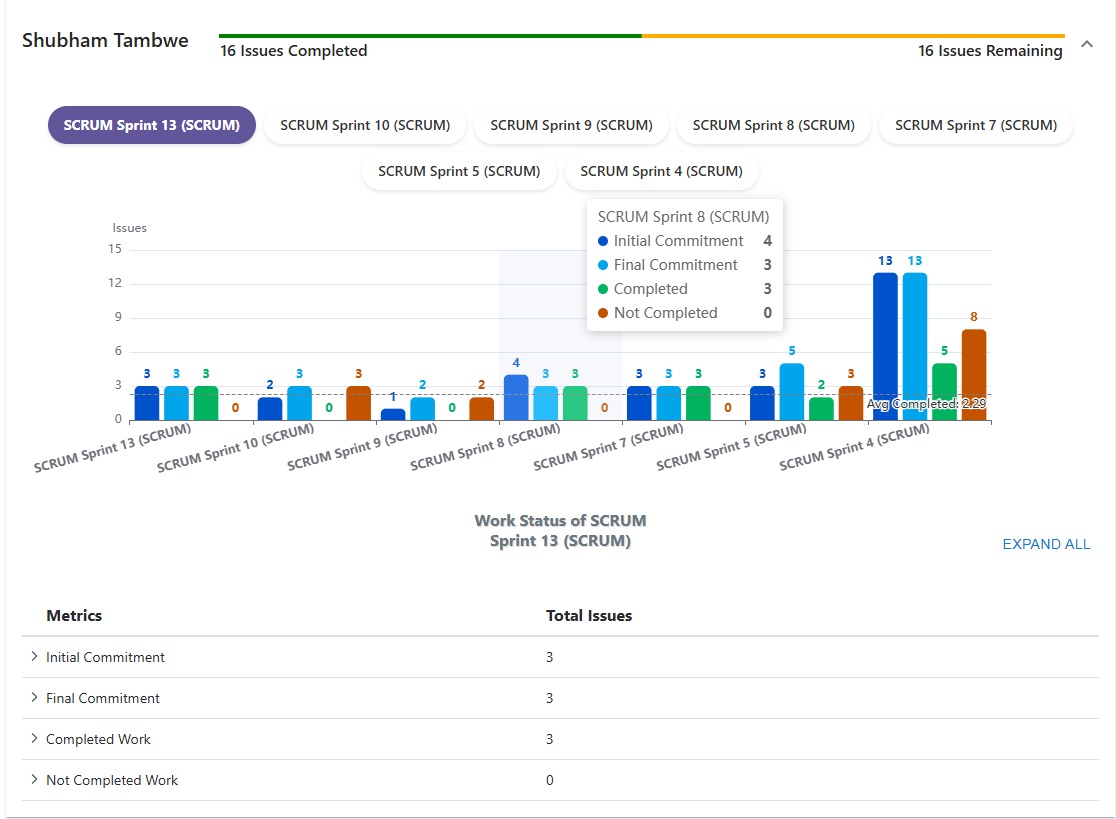
Spreadsheets can work for a while, but they often become difficult to maintain and hard to explain in a planning meeting. Visual dashboards and reports make historical completion trends easier for everyone to review. Instead of debating which version of a spreadsheet is current, your team can focus on what the delivery data is telling you.
Velocity alone is not capacity. A team may have delivered steadily in recent sprints, yet upcoming leave, training, support commitments or shared specialists can reduce the time available for release work. Review those known constraints before turning velocity into a delivery date.
It also helps to separate known reductions from unknown risks. Planned absences and fixed organisational work can be included directly in the forecast. Unplanned work cannot be predicted with the same confidence, so it is better represented through a buffer or a broader delivery range.
Our apps for Jira and Confluence can support clearer planning and reporting views across your workspace. The value is not in producing a more complicated report. It is in helping teams see the relationship between completed work, remaining scope and available capacity without losing the context behind the numbers.
Test Scope and Date Scenarios Before Commitment
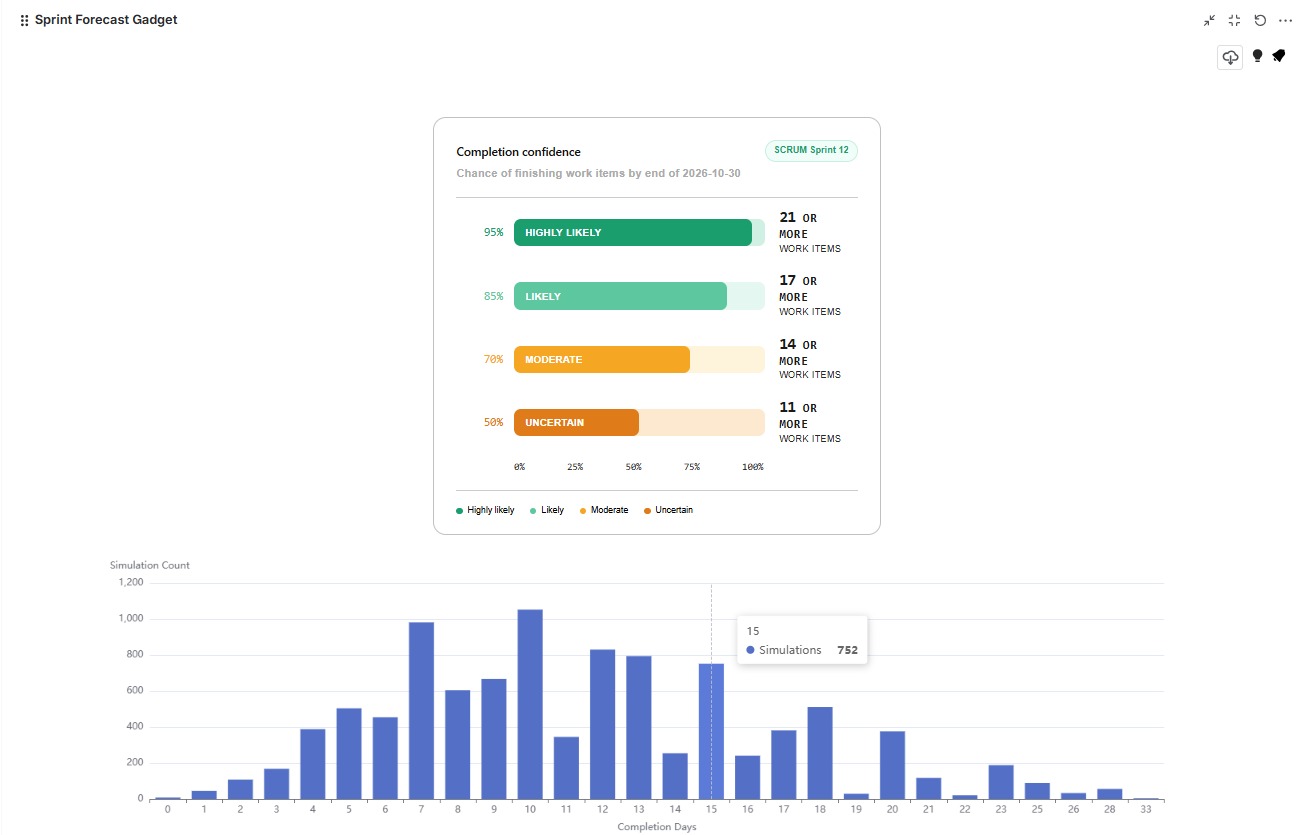
A simple scenario model can make release planning much easier to discuss. Start with the estimated work remaining in the backlog. Then divide that scope by an expected velocity range to estimate how many sprints may be needed. From there, you can map those sprints to a likely release window.
Avoid treating that first calculation as a final answer. Model at least three possible outcomes:
-
A conservative scenario using lower recent velocity and reduced availability
-
A likely scenario based on the representative delivery baseline
-
An optimistic scenario assuming stable capacity and little disruption
These scenarios help stakeholders understand that delivery dates are connected to choices. If a new feature is added, the release may move. If the date cannot move, lower-priority items may need to leave the release. If neither scope nor date can change, the team may need additional capacity or a different delivery approach.
Sprint velocity analytics tools make those trade-offs easier to show. Rather than saying a request is “too much,” you can explain what it means in practical terms. The discussion becomes less about defending a team’s estimate and more about choosing the right balance of scope, time and available people.
Refresh Forecasts as Delivery Conditions Change
Release forecasting is not a one-time planning task. After each sprint, compare what you expected with what was actually completed. A small review can reveal whether delivery is tracking within the forecast range or whether the assumptions behind the plan need to change.
Conditions can shift for many reasons. A new team member may need time to become fully productive. A dependency may take longer than expected. Urgent support work can pull attention away from release scope, while changes in backlog priority may add or remove work altogether.
A regular release health review should bring together completed work, remaining scope, upcoming capacity constraints and major delivery risks. With sprint velocity analytics tools, those conversations can be grounded in current information instead of an outdated plan created at the start of the release.
Make Capacity Forecasting a Team Habit
Better release forecasts come from disciplined use of delivery data, not false certainty. Start with one upcoming release, choose a representative velocity range and account for known capacity changes. Keep the first forecast simple, then improve it as your team learns which factors most affect delivery.
Visual reporting can make these discussions clearer for both delivery teams and stakeholders. When forecasts are reviewed during sprint and release planning, scope decisions become more visible, expectations become easier to manage and teams can protect their focus before delivery pressure builds.
Make Release Capacity Easier To Plan
RVS Softek offers sprint velocity analytics tools that help teams turn sprint data into clearer release planning conversations. Our apps support practical reporting that keeps capacity, scope and delivery priorities visible. If you would like to discuss the right reporting approach for your team, contact us.
Written by the team building RVS Softek's apps for Jira and Confluence.
Ask us a questionMore from the blog
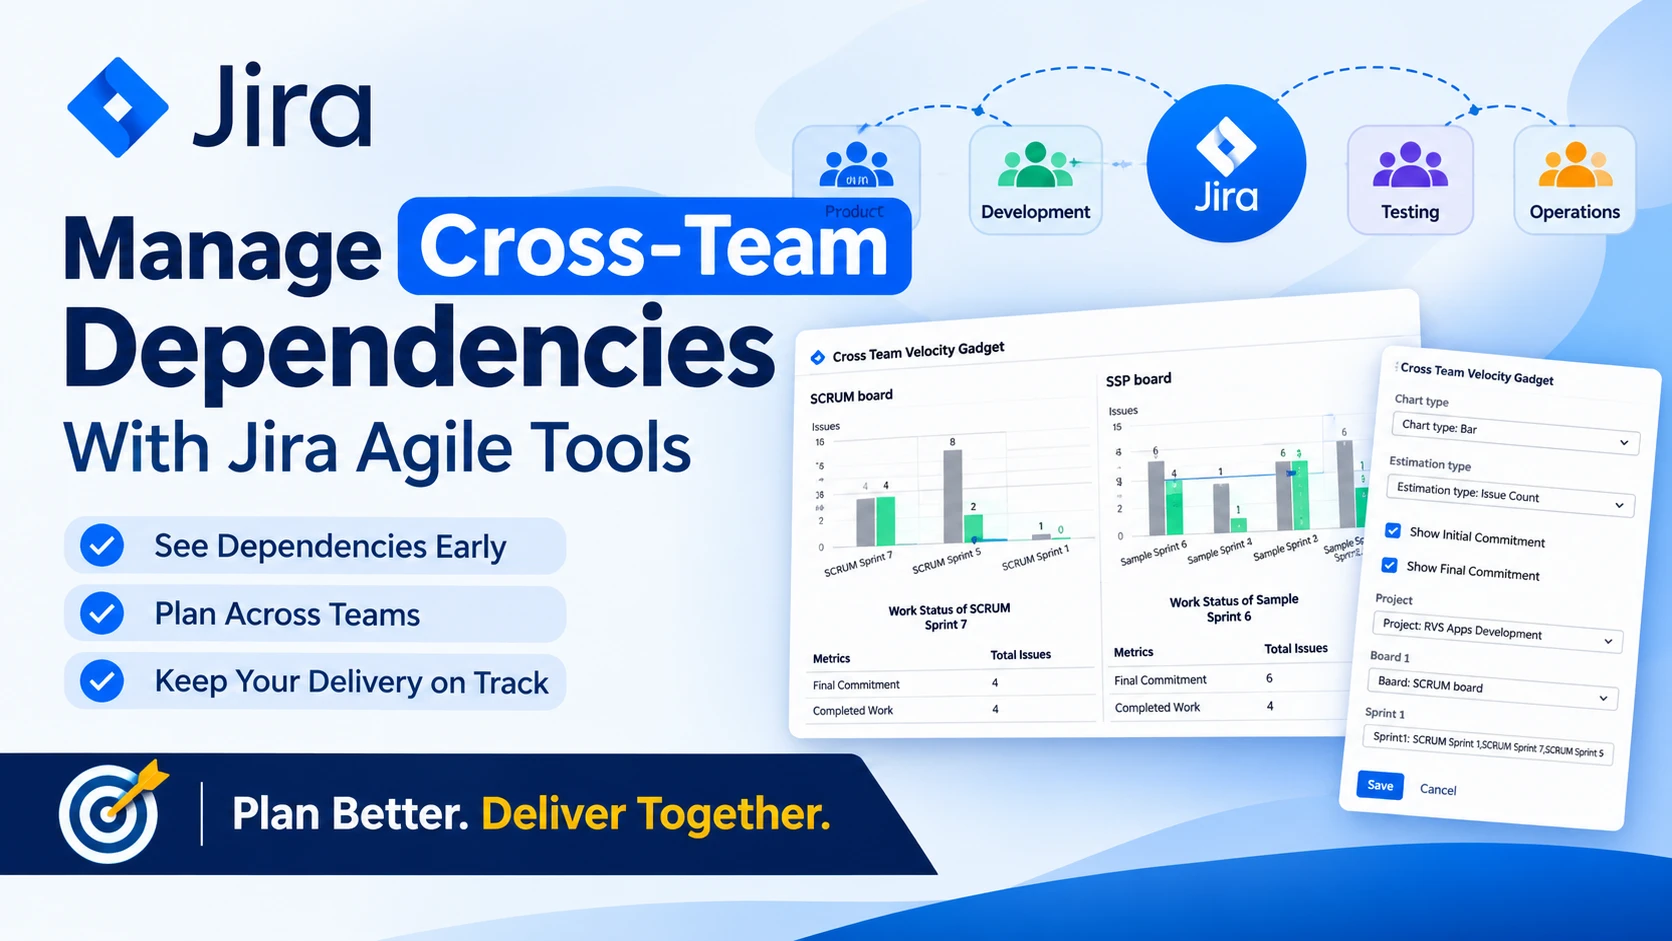
Manage Cross-Team Dependencies With Jira Agile Tools
Explore how Jira Agile planning tools help teams map cross-team dependencies, align priorities and improve coordinated delivery across complex projects.
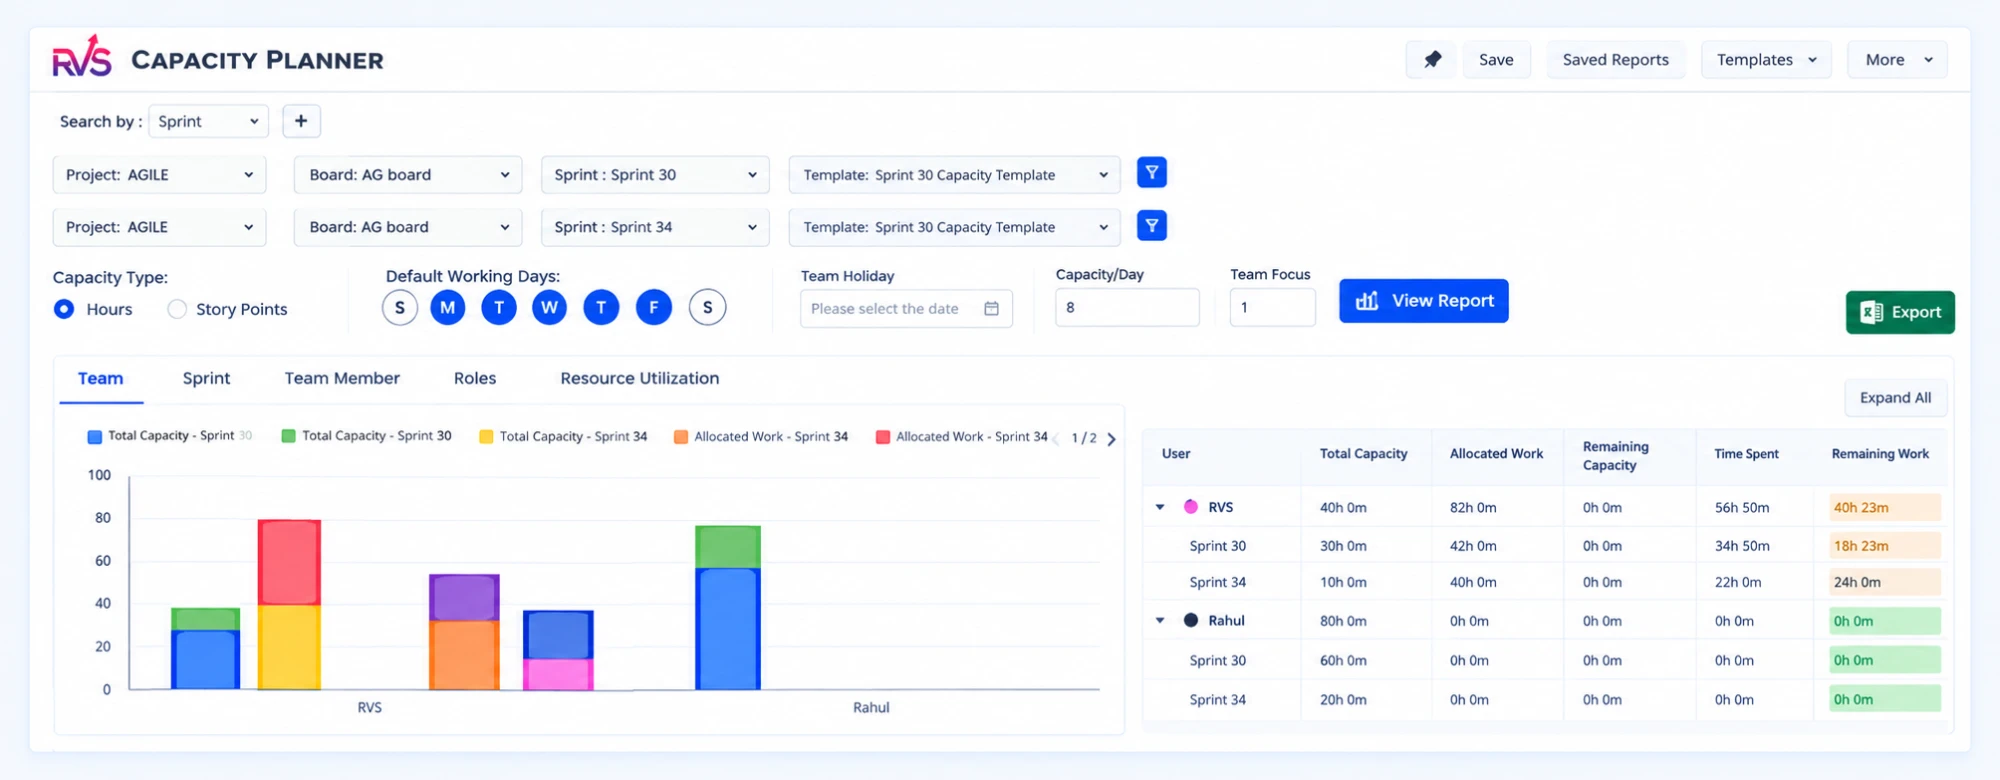
Improve Sprint Delivery With Jira Capacity Planning
Learn why sprint commitments fall short and how Jira capacity management software helps teams balance workloads, plan realistically, and deliver reliably.
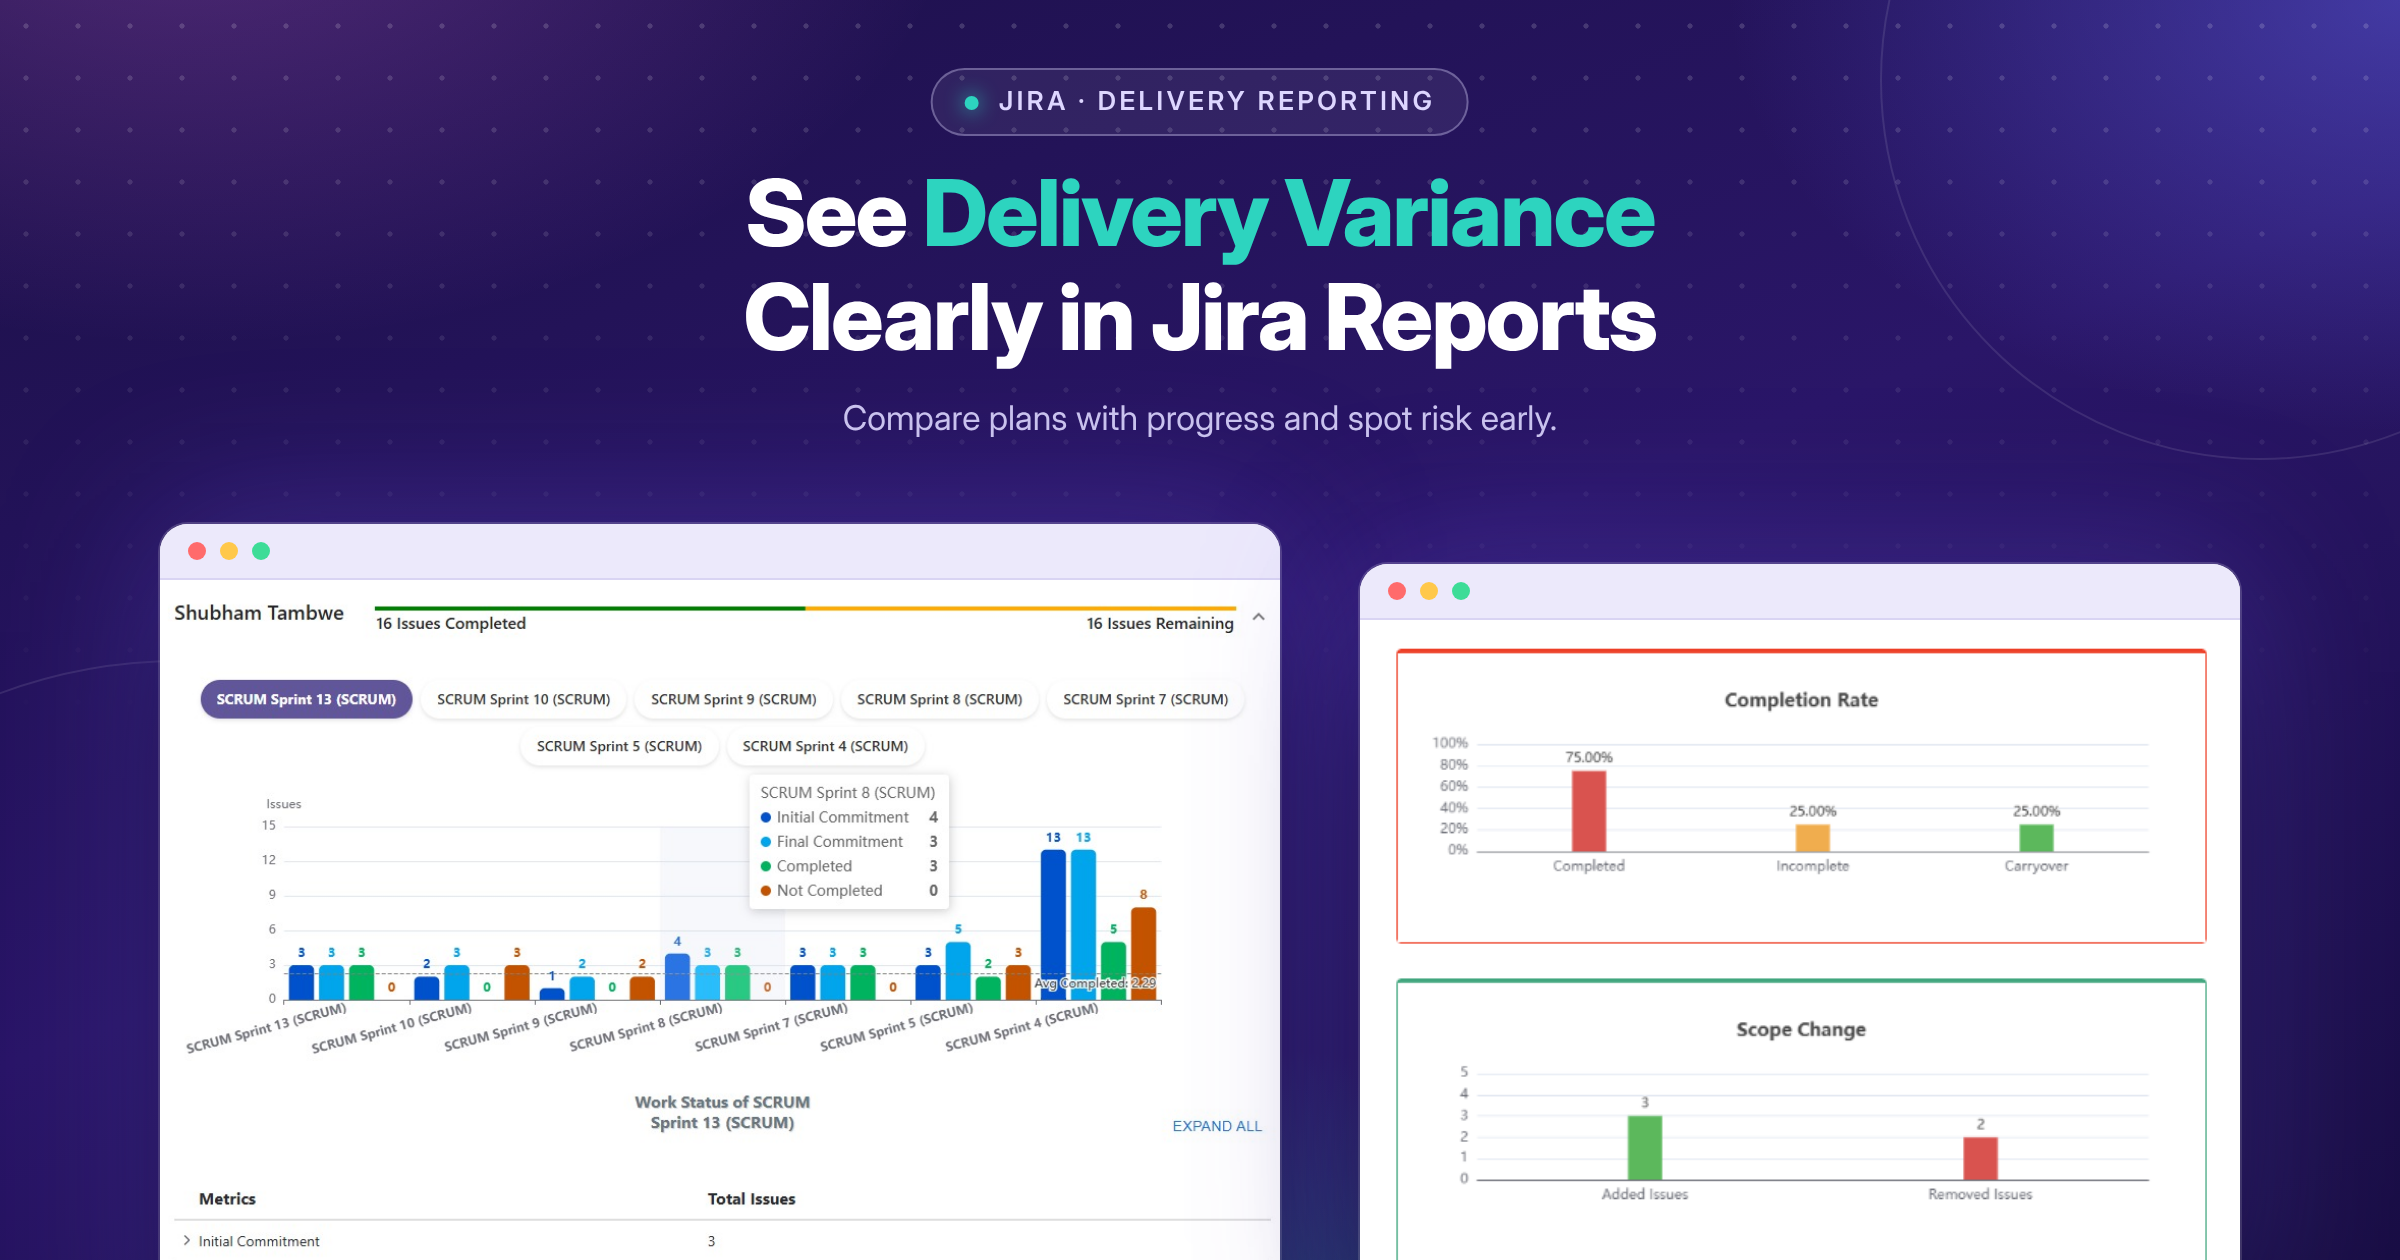
See Delivery Variance Clearly in Jira Reports
Plans change, and delivery risk often stays hidden until a milestone is under pressure. See how focused Jira reports bring scope changes, blockers and unfinished work into view early.
Find the RVS Softek app your team needs
Browse the catalogue for Jira, Confluence and monday.com — or install straight from the Atlassian Marketplace and start a free trial in minutes.
- Free trial on every paid app
- Runs on Atlassian
- Support in one business day

18 apps · 2,010+ installs · Runs on Atlassian