This blog highlights the 5 benefits of using Jira Gantt charts to enhance project management. While Jira lacks native Gantt chart features, integrating RVS Agile Tools helps you visualize timelines, manage dependencies, and improve team collaboration. We also guide you through creating Jira Gantt charts and explain why RVS Agile Tools is the best solution to integrate this functionality into your workflow.
A Jira Gantt chart is the missing link between "tracking tasks" and actually "mastering your timeline."
Let’s be honest: Jira is a powerhouse for issue tracking, but trying to visualize a complex, six-month roadmap using only a backlog list is like trying to navigate a new city by looking through a straw. You see the immediate turns, but you have no idea where the dead ends are.
To bridge that gap, integrating a high-performance plugin like RVS Agile Tools transforms your project data into a living, breathing roadmap. It’s time to move beyond simple ticket management and embrace these project management superpowers:
Total Dependency Visibility: Stop guessing which bottleneck is stalling your progress.
Real-Time Resource Balancing: See exactly who is overworked (and who isn’t) at a single glance.
Dynamic Scheduling: Shift one deadline and watch the entire project intelligently adjust in seconds.
Stakeholder Alignment: Turn messy spreadsheets into a sleek, visual narrative that anyone can understand.
Whether you’re juggling agile sprints or massive cross-functional launches, adding a Jira Gantt chart to your arsenal ensures you aren't just managing tasks—you're mastering outcomes. Here are the 5 superpowers that will redefine how your team hits its milestones.
What is a Jira Gantt Chart?
A Jira Gantt chart is the ultimate visual upgrade for your project management stack. While standard Jira boards are great for the "now," a Gantt chart is built for the "next." It acts as a dynamic timeline that bridges the gap between individual tickets and your big-picture goals. Instead of scrolling through an endless list of issues, you see your entire project lifecycle—from the first kickoff to the final milestone—on a single, interactive screen.
Why it Outperforms Standard Boards
Think of a Gantt chart as the "GPS" for your project. Here is how it changes the game:
Visual Storytelling: Instantly see task durations and deadlines mapped against a calendar.
Dependency Mapping: Stop flying blind. Connect tasks so you know exactly how a delay in "Design" will impact "Deployment."
Real-Time Flexibility: Drag and drop tasks to update schedules instantly—no more manual date editing for 50 different tickets.
Resource Clarity: Monitor who is doing what, ensuring no team member is drowning in work while others are idle.
Unlike Jira’s default views that focus on "What are we doing today?", a Jira Gantt chart answers the most important question in business: "Are we actually going to finish on time?"
5 Super Benefits of Jira Gantt Charts
Visualize Your Entire Project Timeline
A Jira Gantt chart provides an immediate visual overview of your entire project, breaking down the timeline into easily digestible segments. This visual representation allows your team to see at a glance when tasks are scheduled, how long they will take, and how they fit into the larger project timeline.
How it helps:
This benefit is particularly valuable for teams working on long-term projects with multiple deadlines. The Jira Gantt chart lets you break down complex projects into manageable segments, providing your team with a clear understanding of what needs to be done and by when.
By mapping out tasks visually, project managers can ensure that all team members are aligned and on track to meet deadlines. It also allows you to monitor dependencies and track project milestones, ensuring that critical deadlines are met and the project stays on schedule.
Manage Task Dependencies and Prevent Delays
One of the key features of a Jira Gantt chart is its ability to map out task dependencies. When you’re managing a complex project, understanding how tasks are related to one another is crucial. A Jira Gantt chart clearly shows which tasks depend on the completion of others, allowing you to easily spot potential bottlenecks or delays before they occur.
How it helps:
With a Jira Gantt chart, you can visually track the relationships between tasks, such as when one task needs to be completed before another can begin. This ensures that work progresses in the right order, avoiding delays caused by missing dependencies.
For example, in a software development project, you may need to complete the design phase before beginning the development phase. The Jira Gantt chart will clearly show this dependency, making it easy to identify when certain tasks are overdue and need to be addressed.
Optimize Resource Allocation and Balance Workloads
Effective resource allocation is essential for keeping a project on track. Jira Gantt charts help project managers ensure that no team member is overburdened, and resources are being utilized efficiently. With a Jira Gantt chart, you can visually track who is assigned to which tasks, when they’re expected to complete them, and how much work they have on their plate.
How it helps:
By having a clear view of task assignments, you can adjust workloads in real-time to ensure no one is overloaded. You can also ensure that resources with specific skill sets are allocated to the appropriate tasks, improving the quality and speed of work. If you see a team member is overloaded, you can redistribute tasks to ensure everyone is working at an optimal pace.
For example, if two team members are working on overlapping tasks, the Jira Gantt chart can help you redistribute tasks to balance the workload more evenly. This feature not only boosts team efficiency but also helps improve morale, as team members are not overwhelmed with too many tasks.
Track Progress with Real-Time Updates
The real-time nature of a Jira Gantt chart is one of its most valuable features. As tasks progress or get delayed, the Gantt chart automatically updates to reflect these changes. This real-time update ensures that you’re always working with the most up-to-date information, enabling you to make timely adjustments when necessary.
How it helps:
The ability to track project progress in real-time is crucial for staying on top of any potential issues. If a task is delayed, the Jira Gantt chart automatically adjusts the schedule and informs you of any changes that might impact the rest of the project. This allows you to act quickly to prevent issues from snowballing into bigger problems.
For example, if one task is delayed, it could push back subsequent tasks that depend on it. With a Jira Gantt chart, you can immediately see the impact of delays and adjust the project plan to minimize disruptions.
Improve Collaboration and Communication Across Teams
Clear communication and collaboration are essential for any successful project. A Jira Gantt chart helps ensure that all team members are on the same page by providing a shared visual of the project timeline. This eliminates confusion about deadlines, dependencies, and project progress.
How it helps:
The Jira Gantt chart acts as a central hub for all project stakeholders, ensuring that everyone has access to the same information. It allows team members to see task assignments, dependencies, and milestones in real-time, promoting transparency and accountability.
With a Jira Gantt chart, project managers can easily communicate project timelines, while team members can track their own tasks and see how their work fits into the larger picture. This shared understanding enhances team collaboration and ensures that everyone is working toward the same goal.
How to Create a Jira Gantt Chart
Creating a Jira Gantt chart involves several steps. You can start by creating tasks and assigning them to team members in Jira, and then use a third-party tool to visualize them on a Gantt chart. Here’s how you can create a Jira Gantt chart:
Define the Project Scope: Start by defining the project's objectives and key deliverables. This will guide the planning process and ensure that tasks align with the overall goals of the project.
List Tasks and Subtasks: Break down the project into manageable tasks and subtasks. These will be the building blocks of your Jira Gantt chart.
Estimate Task Duration: Estimate how long each task will take and include buffer time for potential delays.
Determine Task Dependencies: Identify which tasks are dependent on others, and set those dependencies in your Jira Gantt chart.
Choose a Gantt Chart Tool:
Since Jira doesn’t have native Gantt chart functionality, you’ll need to integrate a third-party tool to visualize your project timeline. Tools like RVS Agile Tools can easily integrate with Jira to create comprehensive Gantt charts. These tools allow you to visualize your tasks, dependencies, and project timeline seamlessly, giving you the full power of Gantt charts right within Jira.
Input Data: Once you have your tasks and dependencies, input them into your chosen tool. The Jira Gantt chart will automatically generate a visual timeline based on this data.
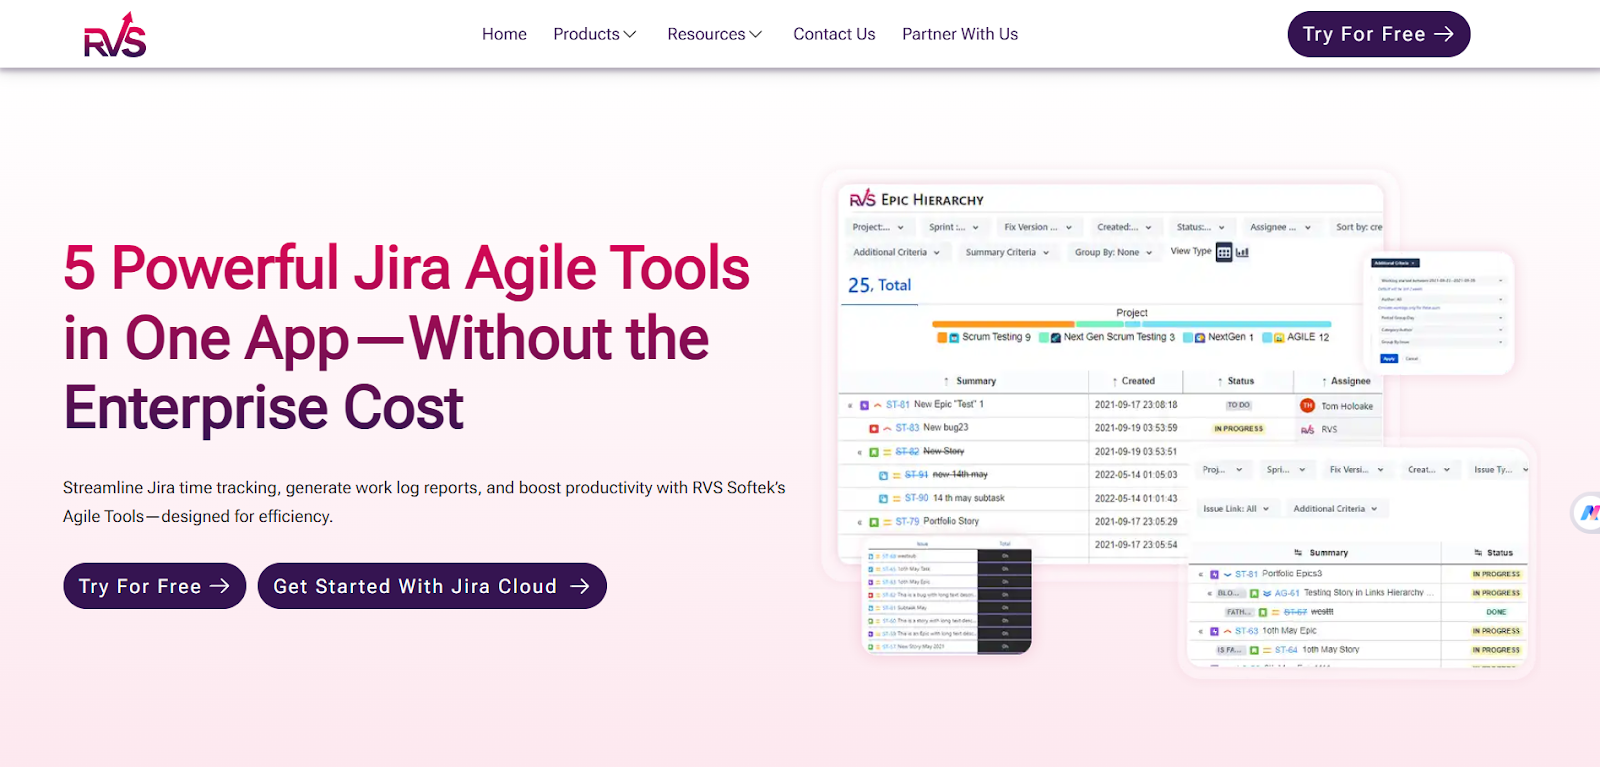
Why Choose RVS Agile Tools for Your Jira Gantt Chart?
RVS Agile Tools provides a suite of powerful Jira plugins designed to enhance agile project management. Their tools integrate seamlessly with Jira to give teams the flexibility and power they need to manage complex projects.
Among their offerings, RVS Agile Tools includes features like:
Time in Status Reports
Worklog Timesheet & Time Tracking
Link Hierarchy
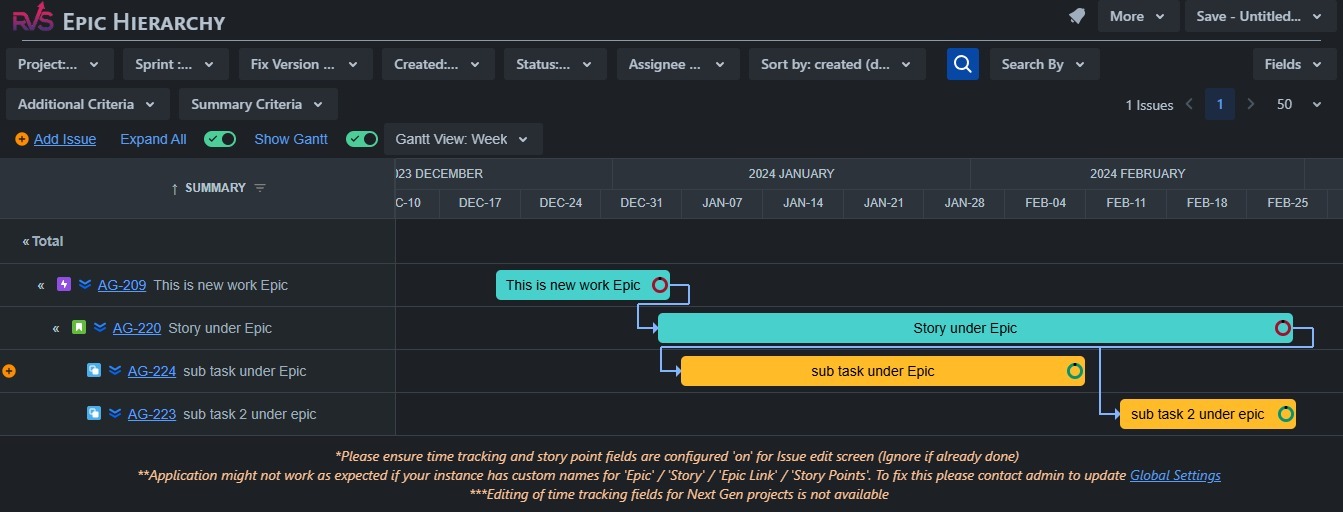
Epic Hierarchy
and, of course, Gantt Chart for Jira Cloud.
While Jira’s native features help with basic task tracking, RVS Agile Tools brings advanced, user-friendly Jira Gantt chart functionality that allows teams to manage projects more efficiently. Here’s how RVS Agile Tools helps with Jira Gantt charts:
Customizable Gantt Charts: Unlike basic Gantt charts, RVS Agile Tools integrates with Jira to provide dynamic, customizable Gantt charts, giving you the flexibility to visualize your project timelines based on your unique needs.
Track Task Dependencies: With RVS Agile Tools, you can easily visualize task dependencies across multiple levels of your project. This feature ensures that tasks are completed in the correct order, improving coordination and reducing delays.
Real-Time Updates: RVS Agile Tools’ Gantt charts automatically update as tasks are completed or delayed, giving you an up-to-date picture of your project’s progress. This helps you stay on track and adjust timelines when needed.
Enhanced Collaboration: The visual nature of Jira Gantt charts fosters better communication among stakeholders. With RVS Agile Tools, your team can access a shared visual timeline that ensures everyone is aligned and informed.
By integrating RVS Agile Tools with Jira, you get more than just a basic Gantt chart—you get a comprehensive, user-friendly solution that helps your team plan, track, and deliver projects with efficiency.
Conclusion
A Jira Gantt chart is an essential tool for teams looking to streamline project management, visualize timelines, and improve collaboration. While Jira itself doesn’t provide native Gantt chart functionality, integrating RVS Agile Tools offers a powerful solution that enhances your project management workflow.
With RVS Agile Tools, you can easily manage dependencies, track progress in real-time, and ensure seamless communication across teams, all within Jira.
Ready to take control of your project timelines and enhance your Jira experience?
Jira Gantt charts are visual tools that allow you to plan, track, and manage projects by mapping tasks and timelines, providing a clear overview of project progress.
2. How do Jira Gantt charts improve project management?
Jira Gantt charts enhance project management by providing a visual representation of tasks, dependencies, and timelines, helping teams stay organized and on schedule.
3. What are the key benefits of using Gantt charts in Jira?
Key benefits of Jira Gantt charts include improved project visibility, better resource management, clearer task dependencies, simplified scheduling, and streamlined collaboration.
4. Can Jira Gantt charts be customized for specific projects?
Yes, Jira Gantt charts can be customized to match specific project needs by adjusting task durations, dependencies, and resource allocations based on project requirements.
5. How do Jira Gantt charts help with tracking project deadlines?
Jira Gantt charts provide a visual timeline of project tasks, making it easier to track deadlines, identify delays, and ensure projects are completed on time.
6. Are Jira Gantt charts suitable for both small and large projects?
Yes, Jira Gantt charts are flexible and can be used for both small and large projects, offering a scalable solution for managing tasks and resources effectively.
7. How can I integrate Jira Gantt charts with other tools?
Jira Gantt charts can be integrated with other tools like Trello, Confluence, and Slack, allowing for seamless collaboration and better project coordination across platforms.
Recent Blogs
July 13, 2026
How to Create a Report in Jira That Actually Answers Your Time Tracking Question