The Problem: Jira does not show how long issues take to move between workflow stages. Sprint velocity and basic reports only show progress, not where work is actually getting stuck.
The Shift: QA leads who want better release control move beyond velocity metrics and start analyzing status transitions to understand real workflow delays.
The Fix: Use a Jira status transition reporting tool like Time in Status Report by RVS Softek to uncover QA bottlenecks, measure handoff delays, track reopen cycles, and identify slow approval stages before they impact releases.
Keep reading to learn how QA leads use status transition insights to detect hidden testing bottlenecks early and stabilize release cycles before sprint deadlines.
Most release delays do not suddenly appear on release day.
They start building much earlier inside the testing workflow. Tickets stop moving. Bugs reopen repeatedly. Approvals slow down. Regression cycles expand sprint after sprint.
As a QA lead, you need to catch these warning signs early. But Jira boards often make that difficult because in Jira, a ticket sitting in “In QA” for 2 hours looks exactly the same as one sitting there untouched for 2 days.
Instead of only showing the current status of a ticket, these reports help you track how issues actually move through the workflow, where testing slows down, and which bottlenecks start building before the release becomes unstable.
Why Most QA Leads Face Bottlenecks Before Release Week?
Let’s talk about the situation most QA leads face before release week.
Your Jira board looks manageable. Most tickets are already sitting in statuses like “In QA,” “Regression Testing,” or “Ready for UAT.” Nothing immediately looks blocked, and from a sprint tracking perspective, the release still appears healthy.
But your QA team starts reporting a different reality.
One tester says a login bug resurfaced after the developer marked it as fixed. Another mentions that several tickets in “In QA” haven’t actually been tested yet because the staging environment was unstable earlier in the week. Meanwhile, regression testing is slowing down because too many tickets are being entered into QA late.
At this point, you know something is slowing the release down, but the Jira board itself cannot clearly show where the bottleneck is happening. That’s because Jira dashboards only show the current status of a ticket, not the movement history behind it.
If 15 tickets are currently sitting in “In QA,” they all look identical on the board. Jira does not tell you:
Which tickets were entered into QA 20 minutes ago
Which ones have been sitting there untouched for 2 days
Which bugs failed testing multiple times
Which tickets keep moving between Dev and QA
Where approvals or handoffs are getting delayed
From the board alone, everything simply looks “in progress.”
That visibility helps QA teams identify bottlenecks early instead of discovering release instability at the last moment.
How QA Leads Use Jira Status Transition Reports to Catch Testing Bottlenecks
1. Spot QA Queue Build-Up Early
One of the clearest early signals of release instability is growing testing wait time. The pattern usually looks like this:
More tickets are accumulating in QA than in previous sprints
Regression testing is taking 20–30% longer than your baseline
Test-ready issues are waiting several hours before assignment
High-priority bugs entering QA too close to release day
Without a Jira status transition report, these patterns are easy to miss because work continues moving. Tickets change status. Velocity stays consistent. Everything looks fine on the board.
But when you track status duration trends over time, the build-up becomes obvious. You can see which stages are accumulating dwell time, and intervene before the queue becomes a release blocker.
For QA leads, this answers the questions that matter:
Is QA capacity overloaded this sprint versus last?
Are developers pushing incomplete fixes too late in the cycle?
Is the regression scope expanding beyond what the team can absorb?
Are testers burning time on rework instead of new testing?
Catching these patterns on Monday is a capacity decision. Catching them on Thursday afternoon is a release crisis.
2. Detect Reopen Loops Faster
A healthy QA workflow moves forward consistently. When your Jira status transition report shows an issue cycling like this: Development → QA → Development → QA → Development → QA, you're no longer looking at an isolated bug. You're looking at a workflow instability signal.
Transition data helps you measure reopen patterns at scale:
Which modules generate the most QA reopen cycles
Which issue types fail testing repeatedly
Whether the reopen frequency is increasing as you approach the release week
Which developers' fixes have the highest bounce rate
This matters because reopened loops create hidden regression work. Every ticket that bounces backward triggers additional test coverage, additional fix time, and additional validation cycles. At scale, that compounds quickly.
With status transition history Jira data, you can see the compound effect early, escalate unstable areas before they consume your entire QA cycle, rather than discovering the problem on the morning of your release.
3. Stop Depending Only on Sprint Velocity
Velocity has a specific and limited purpose: it tells you how much work a team completed in a sprint. What it cannot tell you is:
How many bugs were reopened during that sprint
How much rework did QA absorb before story points were completed
Which workflow stages became bottlenecks
Whether the workflow was actually stable or simply rushed at the end
This is why QA leads still get surprised near release day, even when sprint metrics look healthy.
A team may complete 45 story points, but QA might have spent 30% of its time retesting failed fixes and handling reopen cycles. Sprint velocity does not reveal that. A Jira status transition report does.
Velocity tells you the output, and status transition history tells you what happened inside the workflow to produce that output.
Both metrics matter, but they solve different problems:
Velocity measures throughput
Jira status transition data exposes workflow instability
As a QA lead, you need both. But when release risk starts building before deployment week, status transition reporting gives you the visibility that sprint velocity cannot.
How to Create a Status Transition Report in Jira to Find Hidden Handoff Delays
Native Jira reporting does not provide visibility into status-to-status transition time. It mainly tracks how long an issue stays within a given status, rather than measuring the time taken to move between two workflow stages. Because of this, the actual delay between handoffs often remains untracked.
To get this level of insight, teams typically rely on a dedicated reporting tool that focuses on workflow transitions. A Jira reporting tool like Time in Status Report by RVS Softek is built specifically for this purpose. It captures transition timestamps and calculates the exact time between statuses, helping teams see where work is getting delayed in real flow rather than just within stages.
This makes it easier to identify real bottlenecks such as QA pickup delays, approval lags, and cross-team handoff gaps.
Step-by-step process to create the report using the Time in Status Report plugin
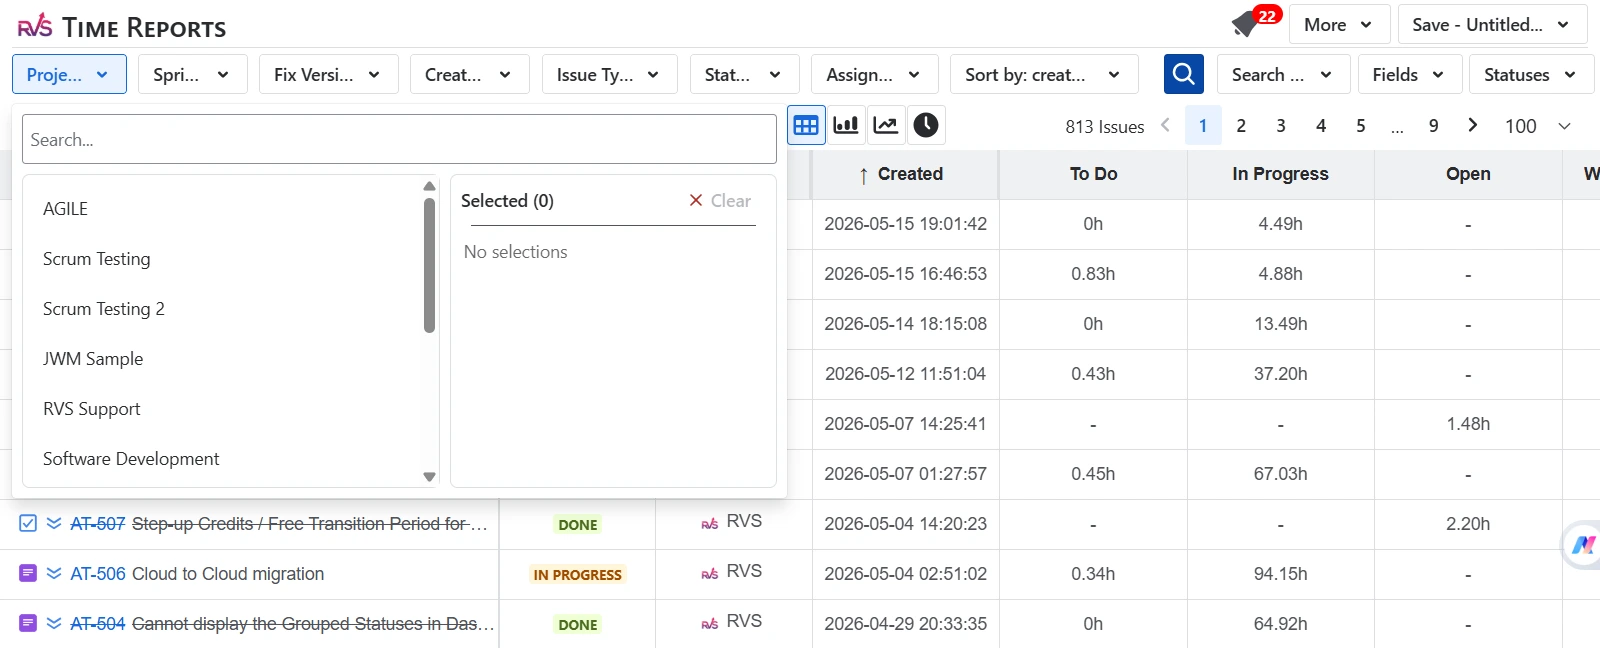
Open it from the Jira apps menu after installation
Step 2: Select project or filter
Choose the relevant Jira project (QA, Development, or full sprint board)
Or apply a JQL filter to narrow down issues (e.g., bugs, sprint tickets, QA tasks)
Step 3: Choose status transition tracking mode
Navigate to the Time in Status Report filter
Select the option to analyze the time between status transitions
This allows tracking gaps between workflow stages (not just time inside statuses)
Step 4: Define workflow statuses
Select key transition pairs such as:
Ready for QA → In QA
In QA → UAT Approved
Dev Done → Ready for QA
These define the handoff points you want to measure
Step 5: Generate the report
Click Generate / Run Report
The tool calculates transition durations between selected statuses
Results are displayed issue-wise, assignee-wise, or team-wise
Step 6: Analyze delays and bottlenecks
Identify where issues spend the maximum waiting time between statuses
Spot QA pickup delays or approval bottlenecks
Use insights to improve workflow efficiency and reduce idle time
What QA Leads Actually Track in RVS Time in Status Reports
RVS Softek Time in Status Reports is built specifically for workflow visibility in Jira. For QA leads managing pre-release cycles, it surfaces the data that sprint boards hide.
Here's what the reporting covers:
Time in status by stage: See exactly how long each issue spent in Ready for QA, In QA, UAT, and Blocked, individually and in aggregate across your sprint.
Status transition history Jira: Full transition timeline for every issue. When it entered each stage, when it moved, and how many times it cycled.
Reopen tracking: Identify which issues bounced between Dev and QA, how many times, and whether reopen frequency is trending upward.
Time between statuses: The gap between specific transitions, the handoff delay between Ready for QA and In QA, or between In QA and UAT Approved.
Trend analysis: Cycle time, lead time, and resolution time trends across sprints. Spot systemic slowdowns before they become release incidents.
SLA percentile calculations: Median and 85th percentile for support and ops teams tracking resolution commitments.
Conclusion
As a QA lead, the releases that go sideways on Friday usually gave you signals on Tuesday. The testing queue was already longer than usual. The reopen rate was already ticking up. The transition gaps were already there in the data.
The difference between catching it and missing it is usually visibility. A Jira status transition report gives you that visibility in real time, not as a post-mortem, but as a working instrument during the release cycle.
Sprint velocity tells you what got done. Status transition history Jira data tells you why it took that long, where the workflow bent, and where the next release is likely to slow down.
If you're running QA without that layer of visibility, you're managing releases with half your instruments covered. The data is already in Jira. Time in Status Reports by RVS Softek is built to surface it.
Frequently asked questions
What is a Jira status transition report?
A Jira status transition report is a workflow analytics view that shows how issues move between different stages in Jira and how long each movement takes. Instead of focusing only on time spent inside a status, it measures the time between transitions such as “Ready for QA → In QA” or “In QA → UAT Approved.” This helps teams understand how work actually flows across the delivery pipeline.
Why do QA leads need status transition reports?
QA leads need status transition reports because most testing delays happen between stages, not inside them. A ticket may sit in “In QA” or “Ready for QA” without clear visibility on how long it waited before action. These reports help QA leads identify hidden delays in testing queues, delayed pickups, repeated testing cycles, and slow approvals, which are often missed in standard Jira boards.
Can Jira natively track status transition time?
No, native Jira does not provide detailed status-to-status transition time tracking. It can show how long an issue stays in a particular status and overall workflow movement, but it does not calculate the exact time gap between two workflow stages. Because of this limitation, teams cannot easily identify handoff delays or compare transition performance across sprints using default Jira features.
How do QA teams use transition data to find bottlenecks?
QA teams use transition data to identify where issues slow down in the workflow. For example, they can detect if tickets are waiting too long before entering QA, if bugs are repeatedly moving back to development, or if approvals in UAT are taking longer than expected. By analyzing these patterns across multiple issues and sprints, QA leads can pinpoint recurring bottlenecks and fix them at the process level instead of reacting to individual delays.
What is the benefit of tracking time between statuses?
Tracking time between statuses gives a more realistic view of delivery efficiency. It shows how long work actually waits between stages, which is often where most delays occur. This helps teams understand QA queue buildup, approval lag, and rework cycles. It also helps distinguish between active work and idle time, which sprint velocity or board views cannot reveal.
Which tool helps create Jira status transition reports?
A commonly used solution is Time in Status Report by RVS Softek from RVS Softek. It is designed to capture detailed workflow movement inside Jira and provides reports on time spent in each status, time between statuses, transition history, and reopen patterns. This makes it easier for QA teams to analyze real workflow behavior without relying on manual tracking or spreadsheets.
How does a status transition report improve release stability?
A status transition report improves release stability by giving QA leads early visibility into workflow risks. Instead of discovering delays near release day, teams can spot increasing QA queues, rising reopen cycles, or slower-than-usual approvals during the sprint itself. This allows them to rebalance workload, fix process gaps, or escalate blockers before they impact the release timeline.
Recent Blogs
July 23, 2026
Jira Time in Status Report: Complete Guide for Project Managers







.webp)
.webp)
.webp)
.webp)

.webp)





