
Prepare Better Sprint Reviews With Jira Insights
Discover how professional Jira gadgets surface sprint progress, blockers and delivery trends, helping teams arrive at reviews with clearer, actionable insights.
Published
Oct 12, 2026
Topic
Reports
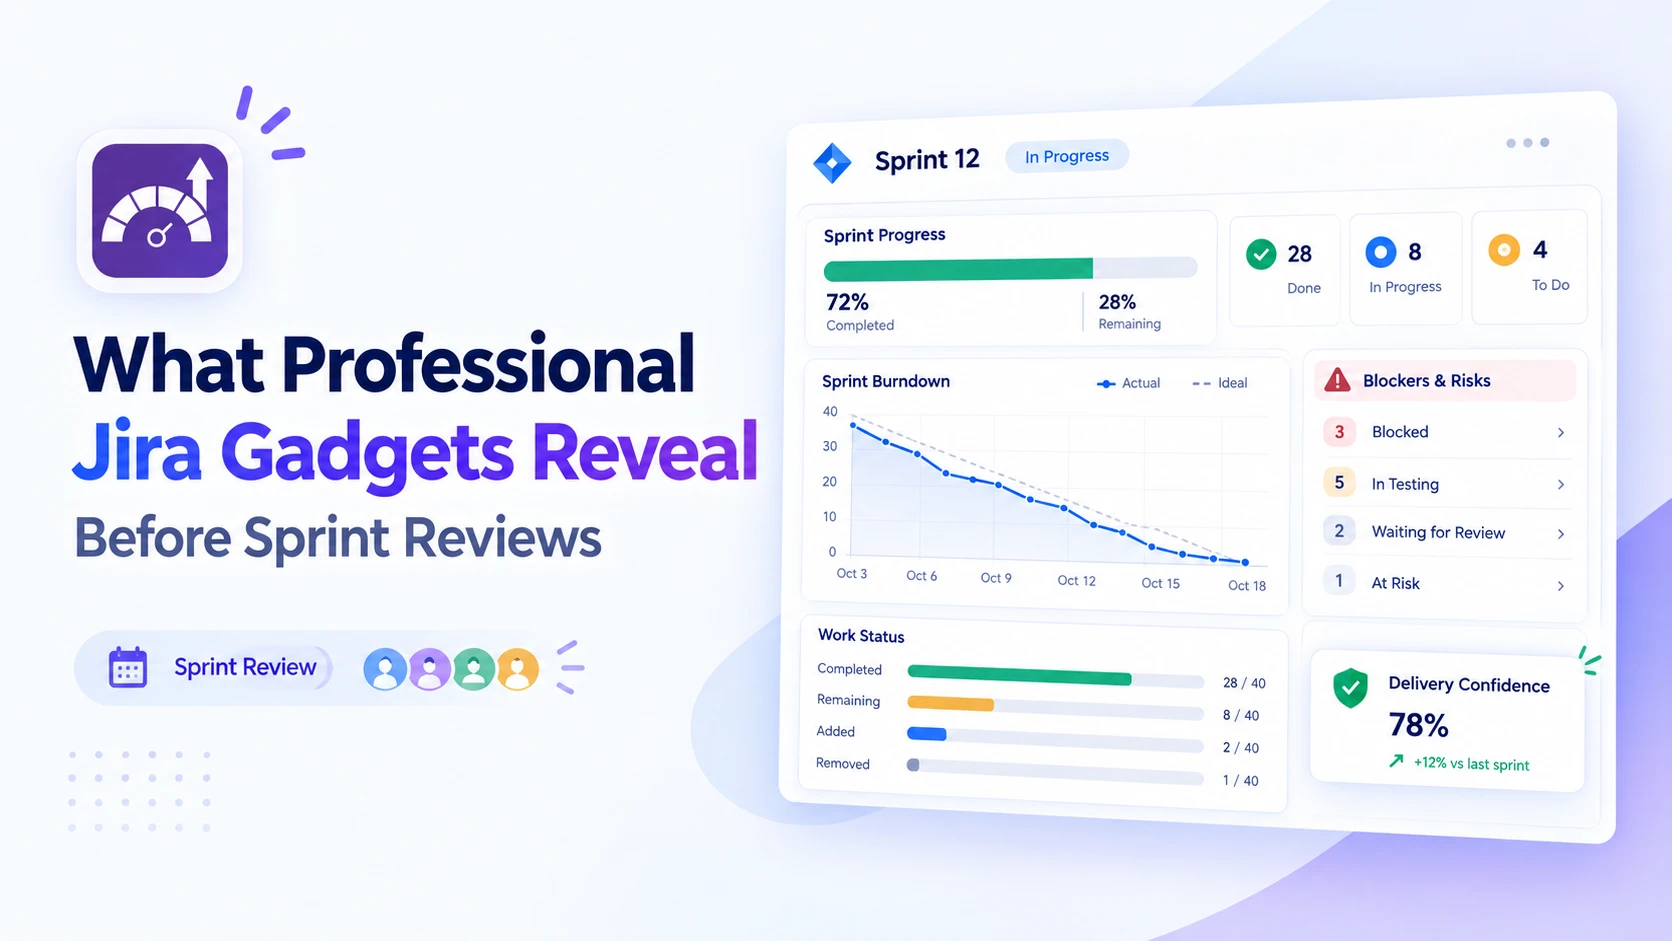
What Professional Jira Gadgets Reveal Before Sprint Reviews
Sprint reviews work best when nobody is seeing the real delivery picture for the first time. Before the meeting begins, your team should already understand what was completed, what slowed down, and what may affect the next release.
October often brings added pressure. Q4 commitments, year-end releases and early roadmap talks can all compete for attention. Professional Jira gadgets can turn live project data into a shared view, so your review starts with evidence rather than a last-minute status chase.
See Sprint Risks Before Reviews Begin
A sprint review is not only a chance to show finished work. It is also a useful moment to talk honestly about progress, customer value and risks that need attention. Well-configured dashboards reveal those risks before the meeting room fills up.
Instead of asking each person for an update, your dashboard can bring together the signals that matter most. This gives Scrum Masters, delivery teams and stakeholders a clearer starting point for useful decisions.
A practical review dashboard may show:
- Sprint progress against the sprint goal
- Issues that are blocked or overdue
- Work still waiting for review or testing
- Upcoming release items and carry-over work
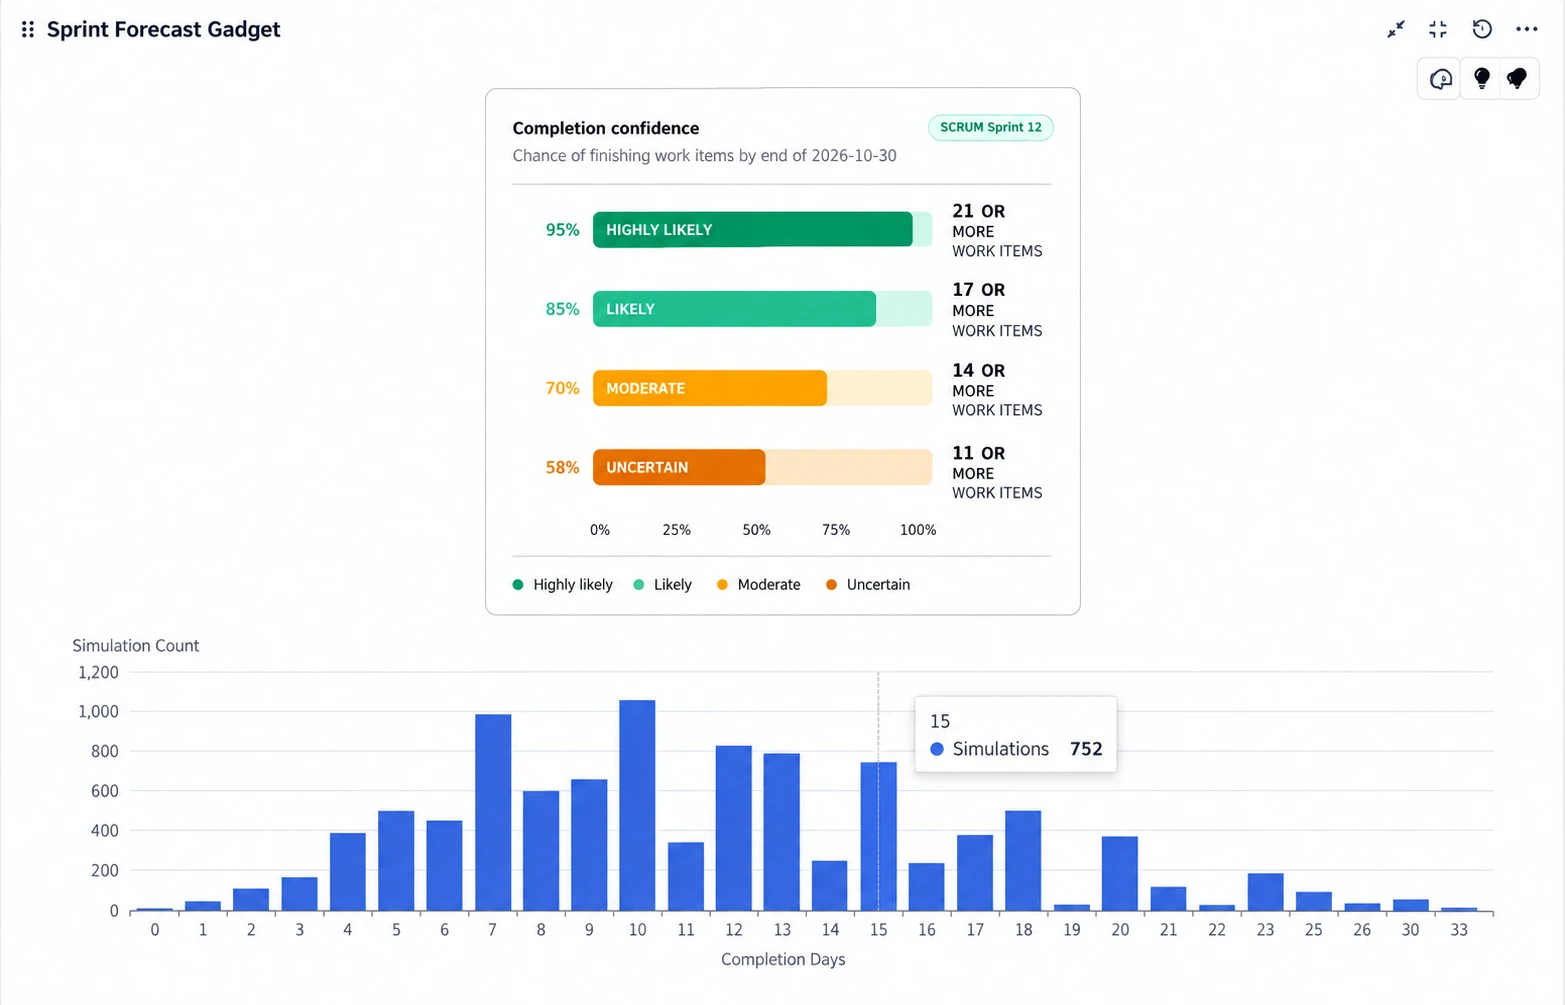
When everyone sees the same information, the conversation can move beyond "What happened?" and towards "What should we do next?"
Professional Jira Gadgets Show Sprint Health Clearly
A long list of completed issues does not always mean a sprint is healthy. A better question is whether the team completed the work it originally planned, while keeping quality and flow in a good place.
Sprint progress gadgets, burndown charts and issue statistics can help you compare completed work with the committed scope. If lots of tickets were added halfway through the sprint, a high completion count may hide the fact that key planned stories are still open.
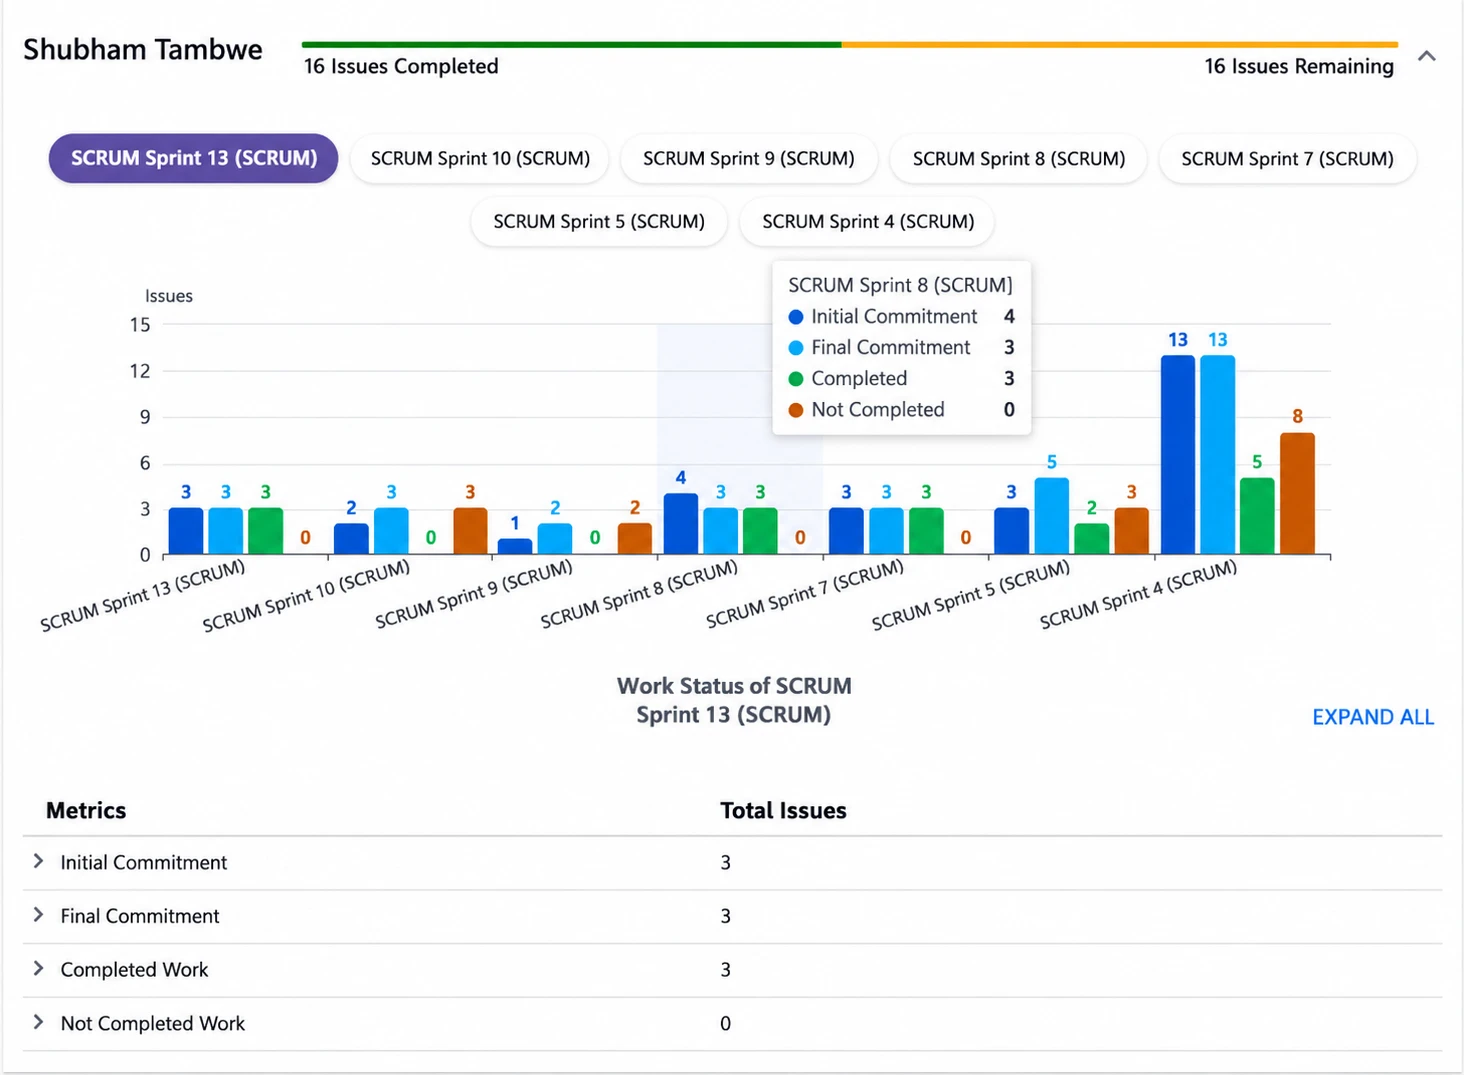
Visual signals can also point to problems early. For example, a cluster of issues sitting in "In Progress" may mean work is too spread out. A growing queue in testing could show a bottleneck. Stories that have not moved for several days may need a closer look before the review.
Delivery teams benefit from a view of workflow stages, ageing work and blockers, while product owners and managers see a simpler picture of sprint goals, completion and release confidence. Both views should come from the same Jira data, so there is no debate over which version is correct.
Professional Jira Gadgets Expose Delivery Drift
Delivery drift happens when a sprint appears busy and productive, but moves away from its original goal. A team may close plenty of smaller tasks while the highest-priority story, customer request or release item remains unfinished.
Professional Jira gadgets can make this easier to spot by showing work added, removed and carried over during the sprint. That context matters. It helps us separate a sensible change in priority from a pattern of scope creep that puts commitments at risk.
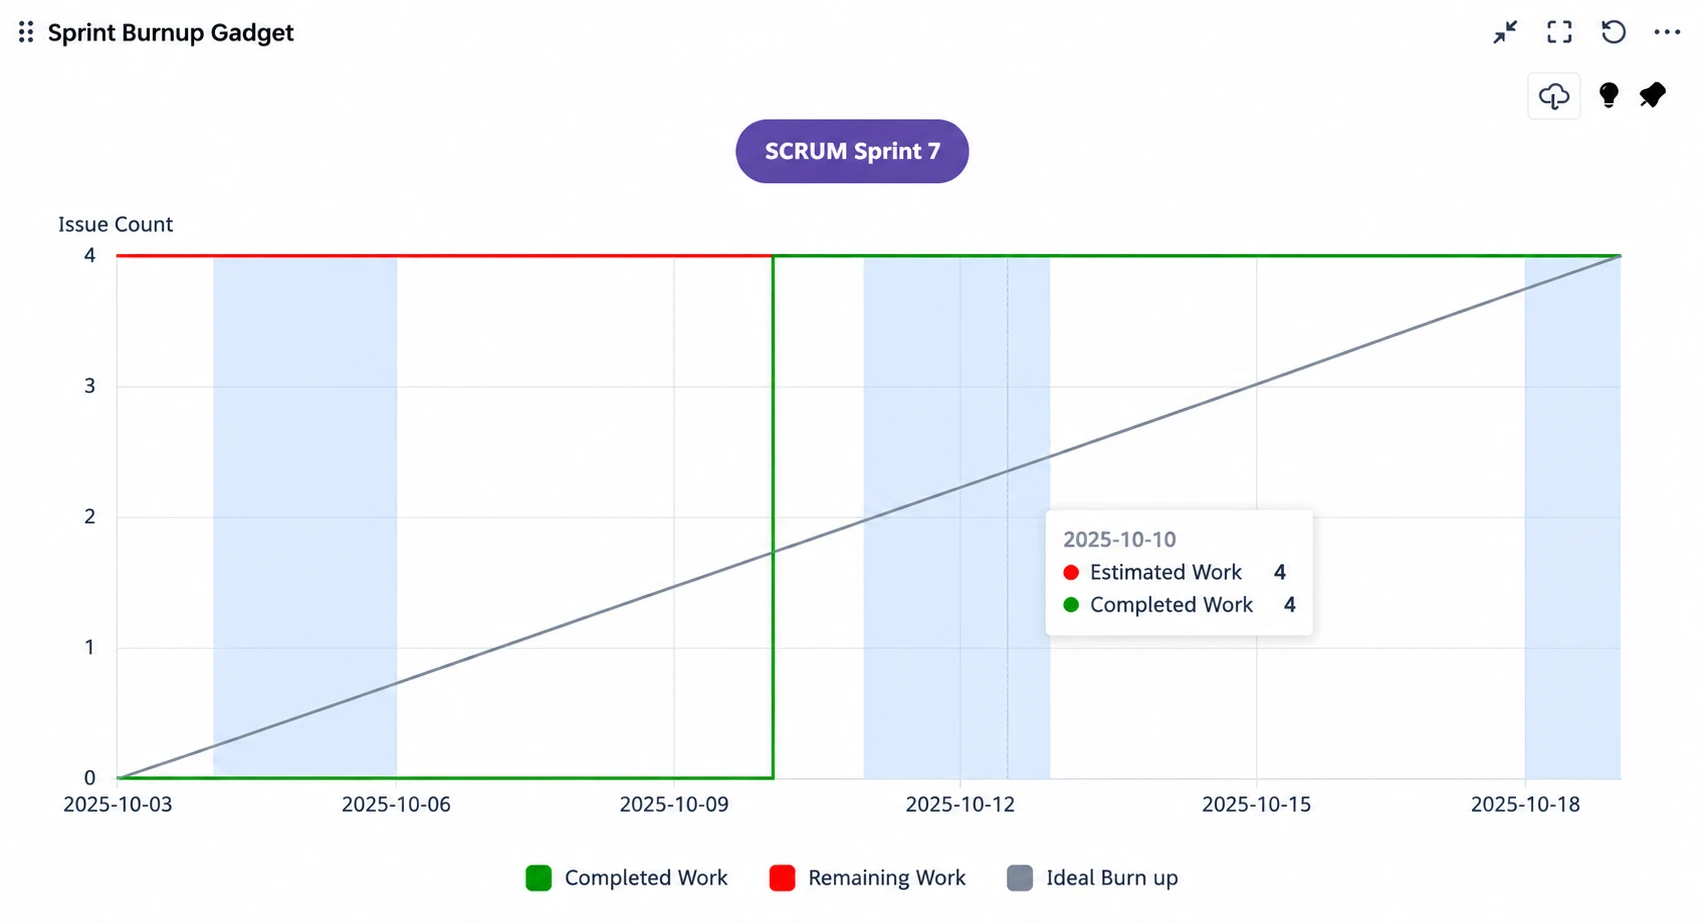
Ageing reports are useful here too. An issue stuck in review, testing or a blocked status may point to unclear acceptance criteria, a dependency problem or limited capacity. Without a dashboard view, that same issue can sit quietly in a queue until somebody asks about it in the sprint review.
Filters make the picture sharper. Work can be segmented by:
- Epic or product area
- Component or delivery team
- Priority level
- Assignee or workflow status
- Customer or business impact
This helps you see whether drift is isolated or affecting a wider initiative. It also gives the team a more focused way to discuss what needs attention.
Uncover Blockers Before Stakeholders Ask
Blockers are rarely a surprise to the person assigned to a ticket. The problem is that they are not always visible to everyone else who needs to act. A dependency on another team, an approval delay or a missing test environment can stay buried in individual issues for days.
Blocked work should feature in the main sprint review dashboard. Grouping it by priority, dependency or team can show which obstacles are most likely to affect the release. Overdue issues and tickets waiting on another group should be easy to spot, not hidden behind several filters.
Common delivery blockers include unresolved dependencies, unclear requirements, supplier inputs, approval queues and limited testing access. Seeing them together helps the team explain the real situation without turning the review into a blame session.
The goal is to separate issues the team can solve directly from outside constraints that need support or escalation. With ownership and next actions visible, stakeholders can help remove obstacles rather than simply hearing that delivery is delayed.
Turn Sprint Data Into Better Review Conversations
The strongest sprint reviews connect Jira work to outcomes. Progress can be shown by epic, release, customer request or strategic initiative rather than only reporting ticket counts. That gives stakeholders a clearer sense of what the completed work means.
A balanced dashboard should also leave room for the less comfortable parts of delivery. Completed issues belong beside open defects, carry-over work, release risks and feedback that may affect the next sprint. An honest view is more useful than a dashboard designed only to look green.
For technical teams, workflow detail and blocker data may be the priority. Senior stakeholders may care more about commitments, release readiness and risks to planned outcomes. Separate views can serve both groups while remaining connected to the same project data.
At RVS Softek, we build Atlassian Marketplace apps for Jira, Confluence, Jira Service Management and monday.com, with a focus on planning, reporting, documentation, visualisation and collaboration. The right combination of views can make delivery information easier to understand across the whole team.
Before your next sprint review, start small: track sprint goal progress, completed versus committed work, blocked issues, ageing tickets and release readiness. Refine the dashboard as your team's ways of working change, especially during busy Q4 delivery periods. A useful dashboard should help you ask better questions before the review starts, not just produce more charts.
Turn Sprint Data Into Clearer Decisions
At RVS Softek, we help teams choose professional Jira gadgets that make delivery risks, dependencies and progress easier to discuss. Our approach focuses on dashboards that support practical conversations across product, development and leadership teams. If you would like support tailoring your Jira reporting, contact us to discuss your requirements.
Written by the team building RVS Softek's apps for Jira and Confluence.
Ask us a questionMore from the blog
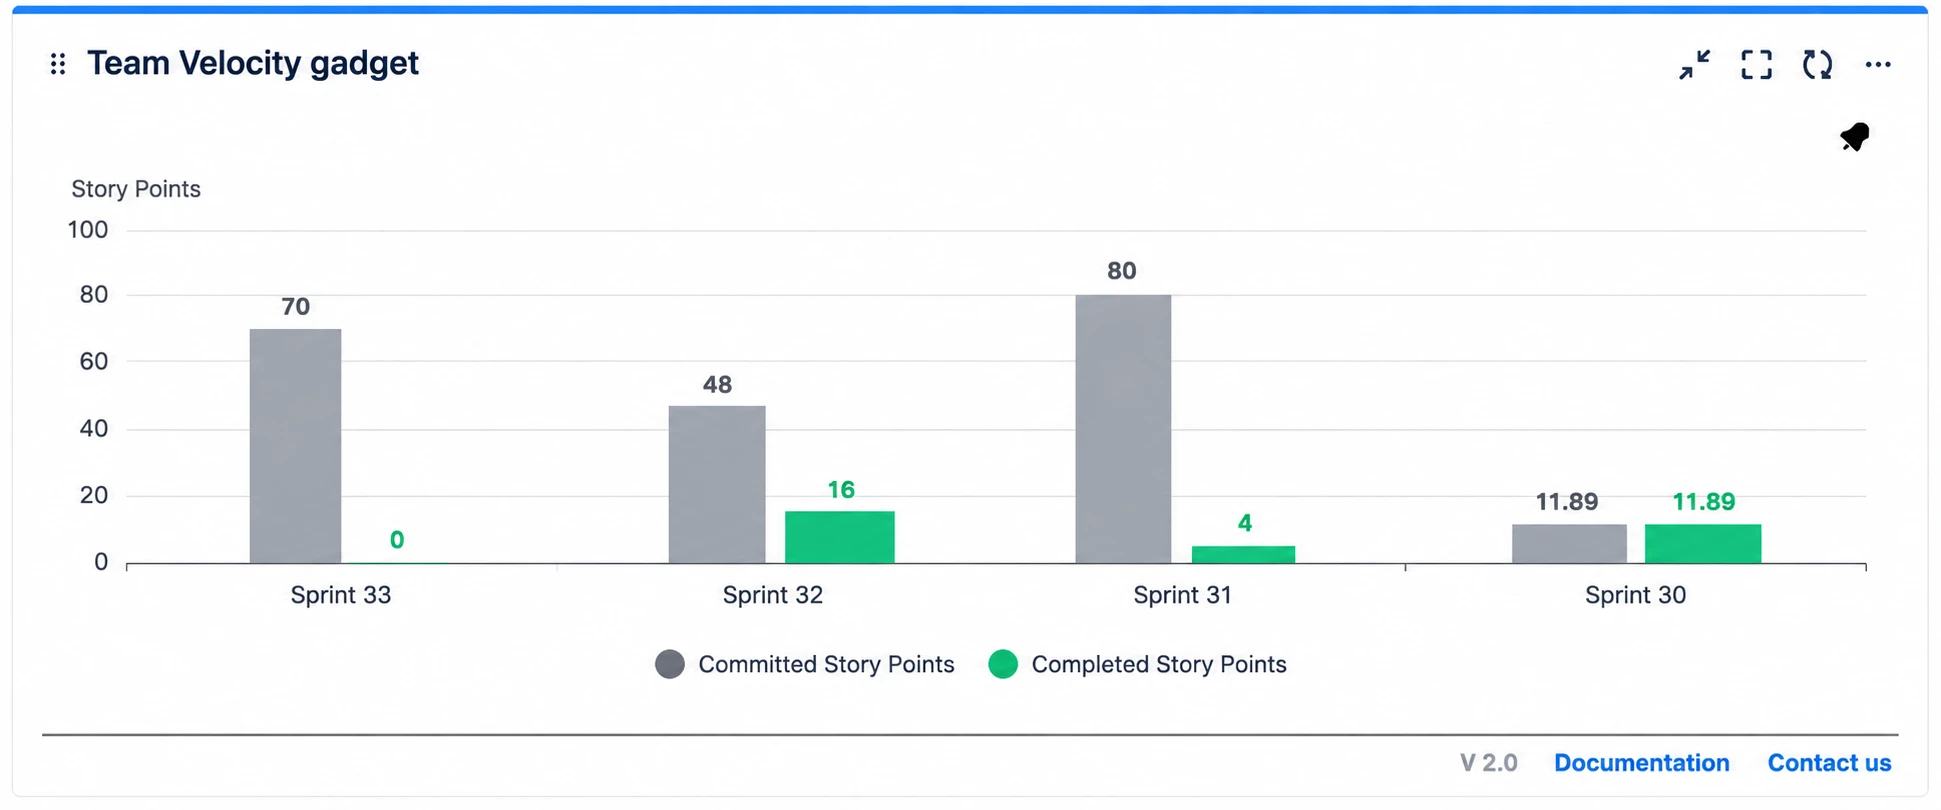
Sprint Reviews: Jira Dashboards or Spreadsheets?
Compare Jira reporting dashboard tools with spreadsheets for sprint reviews. See which option gives agile teams clearer, faster insights and better decisions.

Choosing Dynamic Diagrams for Better Technical Docs
Explore how PlantUML Confluence integration compares with static diagrams, helping technical teams keep documentation accurate, visual and easy to update.
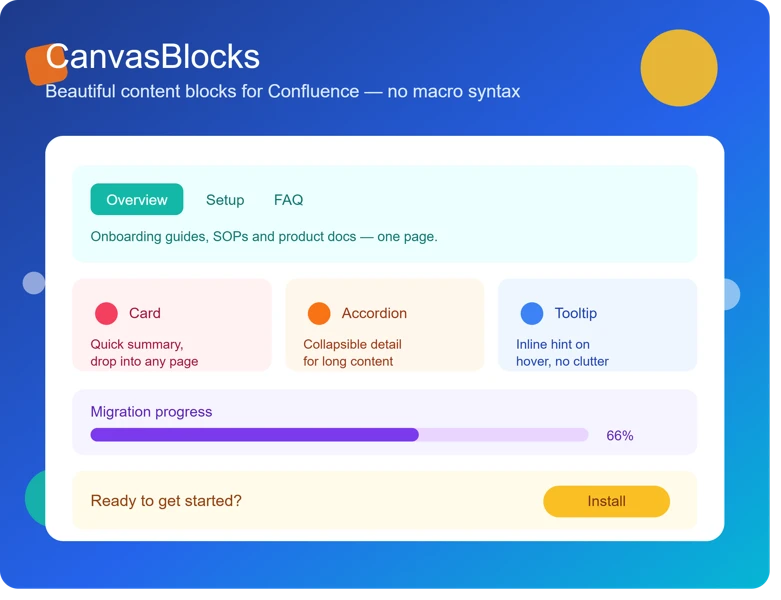
5 Signs Your Confluence Content Needs Formatting Upgrades
Discover the warning signs that signal your team needs Confluence page formatting apps to create clearer, more consistent, and engaging documentation.
Find the RVS Softek app your team needs
Browse the catalogue for Jira, Confluence and monday.com — or install straight from the Atlassian Marketplace and start a free trial in minutes.
- Free trial on every paid app
- Runs on Atlassian
- Support in one business day
16 apps · 1,873+ installs · Runs on Atlassian