The Problem: Velocity and burndown charts show what got done, but they don't reveal where work gets stuck. As a result, sprint reviews often identify symptoms instead of root causes.
The Insight: The 85th percentile shows how long 85% of issues spend in each workflow status, helping teams pinpoint bottlenecks, validate delays with data, and track workflow trends over time.
The Fix: With Time in Status Reports by RVS Softek, teams can visualize 85th percentile status-level metrics, uncover recurring process issues, and make sprint reviews more objective, actionable, and improvement-focused.
Most sprint reviews end the same way. The team closes their laptops, nods at a velocity chart, and agrees to "move faster next sprint." Nobody disagrees. Nobody changes anything. And two weeks later, the same conversation happens again.
That's the pattern this blog is about breaking. Recurring bottlenecks that never get named precisely enough to fix. Sprint reviews that produce vague intentions instead of targeted action.
The tool that makes it possible is not a new process or a longer retrospective. It is one metric, applied at the status level: the 85th percentile.
This blog covers:
What the 85th percentile means
Why the 85th percentile belongs in every sprint review
How it turns a room full of impressions into a room full of evidence.
How Time in Status Report helps in creating 85th percentile report
Why Sprint Reviews Keep Producing the Same Conversation
Sprint reviews rely on velocity and burndown. Both are output metrics. They tell you what got done, not where work got stuck. When the sprint felt slow, velocity won't tell you which status caused it. When issues piled up before QA, burndown didn't flag it mid-sprint.
The result is a room full of impressions: "In Review felt slow." "QA took forever." Honest observations, but not actionable ones. Without status-level time data, sprint reviews can only produce intent. With it, they produce decisions.
What Does 85th Percentile Mean in a Jira Workflow?
The 85th percentile, meaning in workflow terms, is straightforward: it is the time threshold within which 85% of your issues complete a given status, measured across real working conditions. It is not the best-case number. It accounts for busy periods, complex tickets, shift changes, and everything else that makes actual sprints messier than planned ones.
The simple formula:
To calculate the 85th percentile mathematically, you take your total list of completed tasks, sort them by completion time (Cycle Time) from shortest to longest, and find the value at the rank computed with this formula:
Rank = Total Issues × 0.85
For example, if you completed 100 issues, you would look at the 85th issue on the sorted list. If it took that ticket 12 days to complete, your 85th percentile is 12 days.
Why it matters more than averages:
Averages are distorted by outliers: One issue stuck for two weeks skews the average up, making normal performance look worse than it is. The 85th percentile is resistant to that distortion.
It reflects real working conditions: The 85th percentile is built from your actual workflow history, not theoretical capacity.
It draws a clear line: Any issue that exceeds the 85th percentile threshold has taken longer than 85% of comparable work. That is a confirmed signal, not a subjective impression.
It sets a defensible SLA benchmark: Support and ops teams use 85th percentile speed as the basis for SLA commitments because it represents what the team can consistently deliver, not just what it delivers on a good day.
How 85th Percentile Data Changes the Sprint Review Conversation
Bringing 85th percentile data into a sprint review does not just add a number to the agenda. It changes the quality of every conversation that follows.
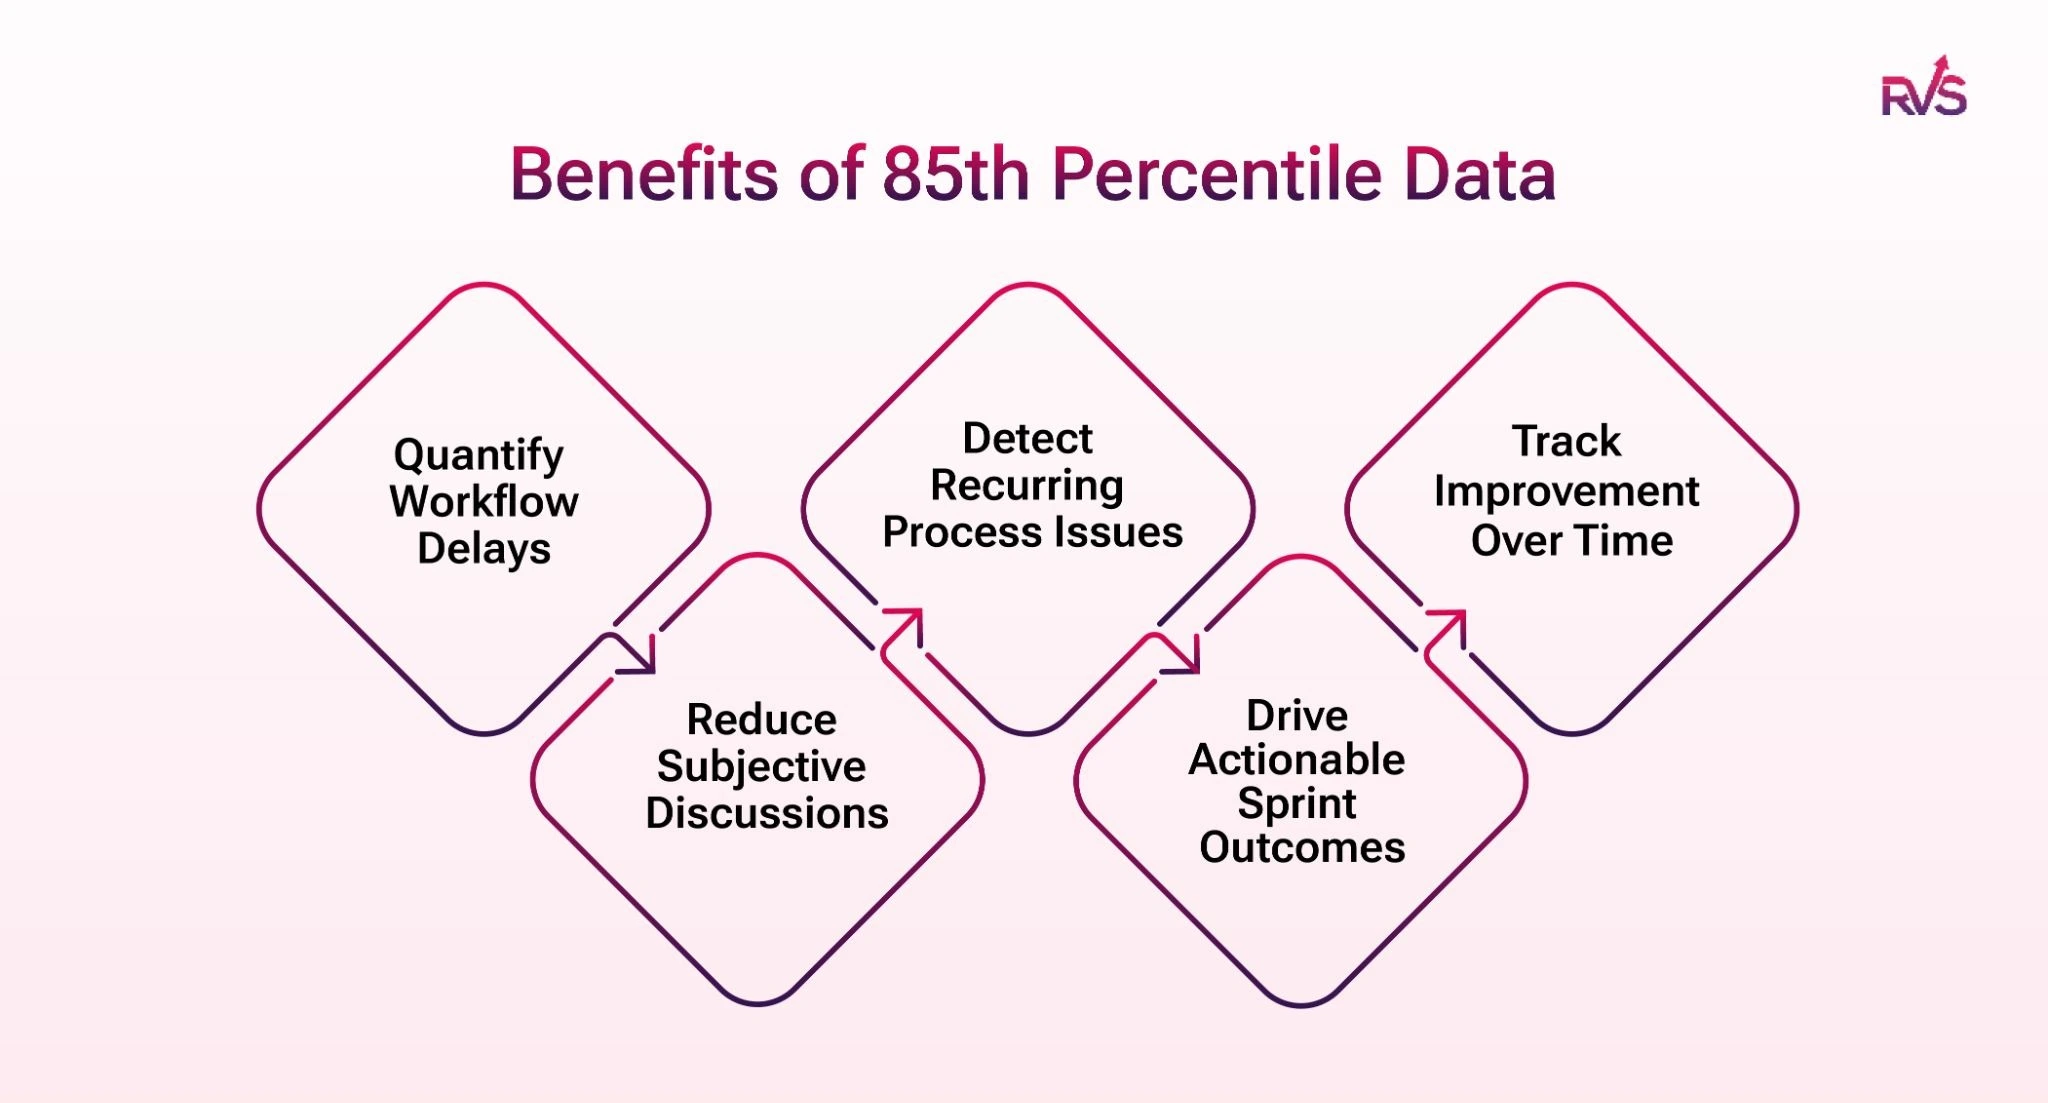
Quantify Workflow Delays: Instead of relying on team perceptions, 85th percentile data shows exactly how long issues spend in each status. Teams can identify delays, measure their impact, and focus on the areas that need attention.
Reduce Subjective Discussions: Sprint reviews become more objective when teams discuss metrics rather than opinions. The conversation shifts from whether a problem exists to understanding its cause and impact.
Detect Recurring Process Issues: A single sprint can reveal a delay, but comparing 85th percentile data across multiple sprints helps teams identify recurring bottlenecks and long-term workflow problems.
Drive Actionable Sprint Outcomes: When teams know which status exceeded expected cycle times, they can take targeted actions such as adjusting workflows, introducing WIP limits, or improving review processes.
Track Improvement Over Time: Teams can compare the same metric from sprint to sprint to determine whether process changes are working. This creates a clear feedback loop for continuous improvement.
The Jira Status-Level Questions You Can Finally Answer
Once you have 85th percentile data broken down by status, a set of sprint review questions becomes answerable for the first time.
Which status consumed the most time this sprint, and was that expected? You might expect In Progress to dominate. If In Review is consuming more time, that is worth examining.
Which issues crossed the 85th percentile threshold, and what do they have in common? Issue type, assignee, label, epic. Patterns in the outliers often point directly to the root cause.
Is this sprint's 85th percentile better or worse than last sprint's? Trend comparison across sprints turns a single data point into evidence of improvement or deterioration.
Where is time being lost between statuses, not just within them? Time between statuses captures transition lag, the gap between a ticket moving to Ready for Deploy and someone actually deploying it. That gap is often where the real bottleneck hides.
None of these questions can be answered reliably using native Jira. Velocity charts and burndown reports show what happened during a sprint, but they rarely explain why it happened.
This is where the Time in Status Reportbecomes valuable. It breaks down how long issues spend in each Jira status, highlights 85th percentile cycle times, and makes it easy to spot bottlenecks, outliers, and workflow delays before they become recurring problems.
Instead of relying on assumptions, teams can see exactly where work slows down, compare trends across sprints, and use real workflow data to drive sprint retrospectives and process improvements.
Time in Status Reports By RVS Softek
Everything described above depends on one thing: having the 85th percentile broken down by status, accessible before your sprint review starts, without manual calculation or JQL workarounds.
Time in Status Reports by RVS Softek is a Jira Time in status plugin built entirely around workflow visibility. Median and 85th percentile are dedicated, first-class report types, not buried inside a broader analytics platform, not something you derive from a raw data export. They are surfaced directly, by status, ready to bring into the room.
Key Features
Time in Status Reports: Gain immediate insights into task progress and spot delays as they happen. Get the information you need to keep your project moving without wasting time digging through data.
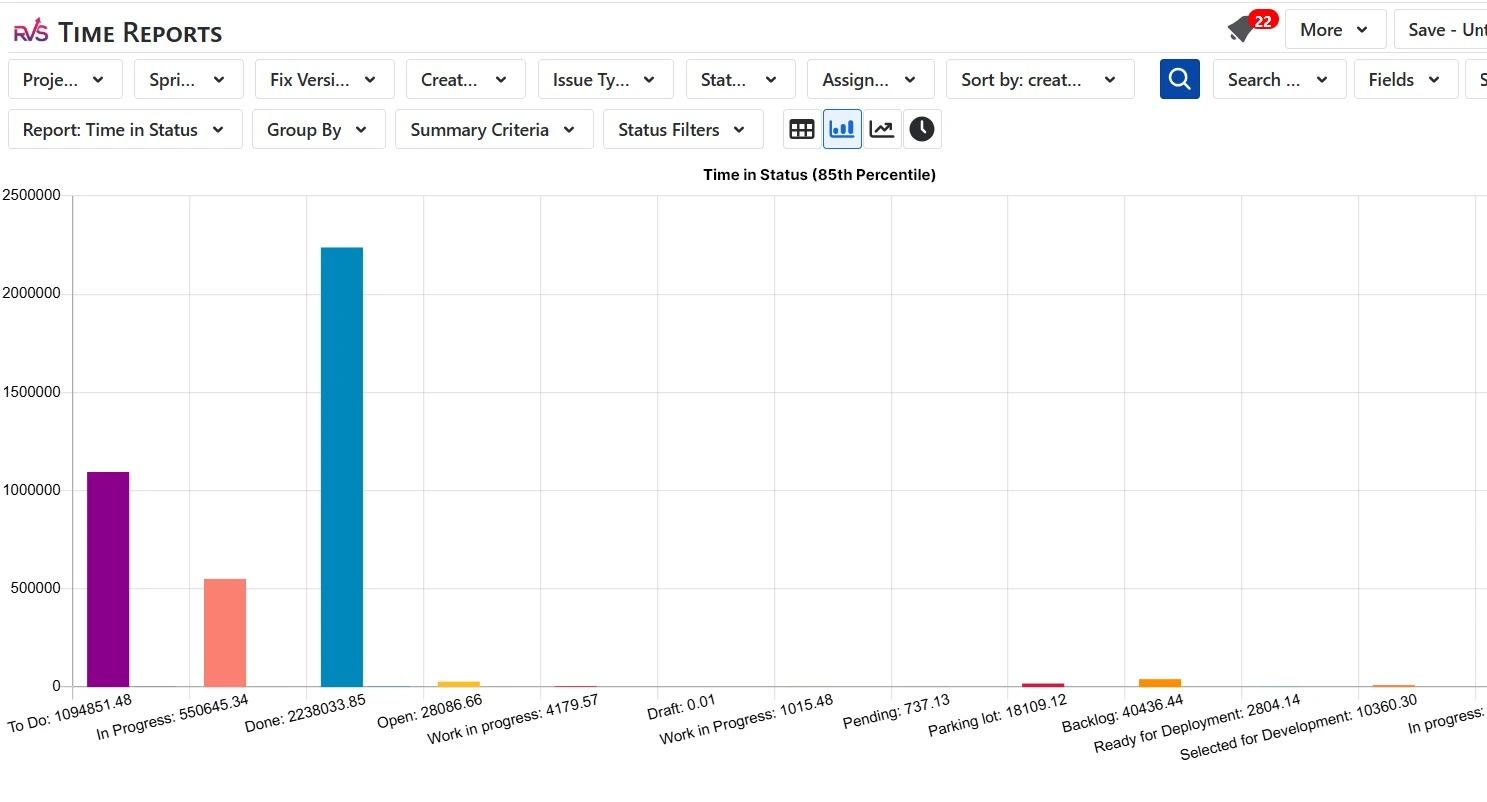
Multiple Chart Types: Visualize workflow data in the format that makes most sense for your team, across bar charts, trend lines, and tabular views.
Easy Data Exports: Export to CSV, Excel, or Power BI via a native JSON feed. Clean, structured workflow data ready for offline analysis or stakeholder reporting.
Customizable Reports: Configure reports by status, assignee, date range, and working calendar. Tailor every view to match how your team actually works.
Real-Time Dashboard Gadgets: Pin key workflow metrics directly to your Jira dashboard. 85th percentile data, cycle time trends, and status breakdowns visible at a glance, before every sprint review.
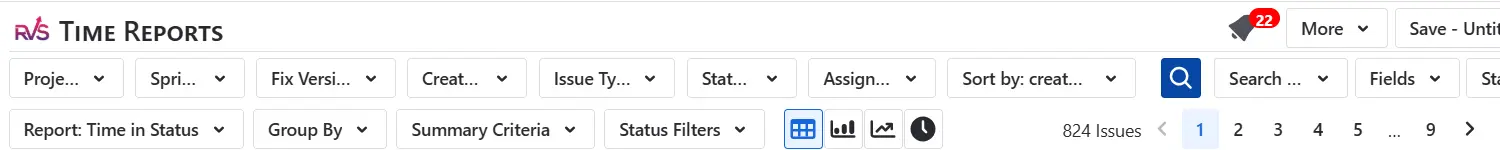
How to View 85th Percentile Data in Jira Using RVS Time in Status Reports
Install RVS Time in Status Reports from the Atlassian Marketplace
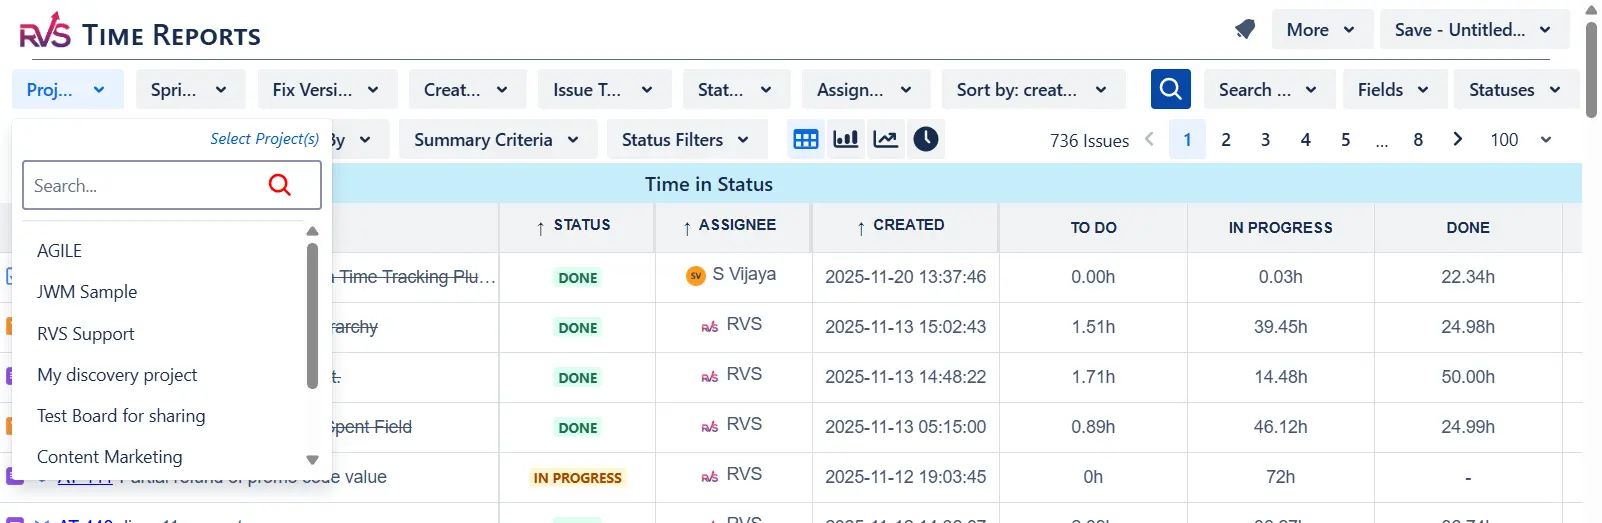
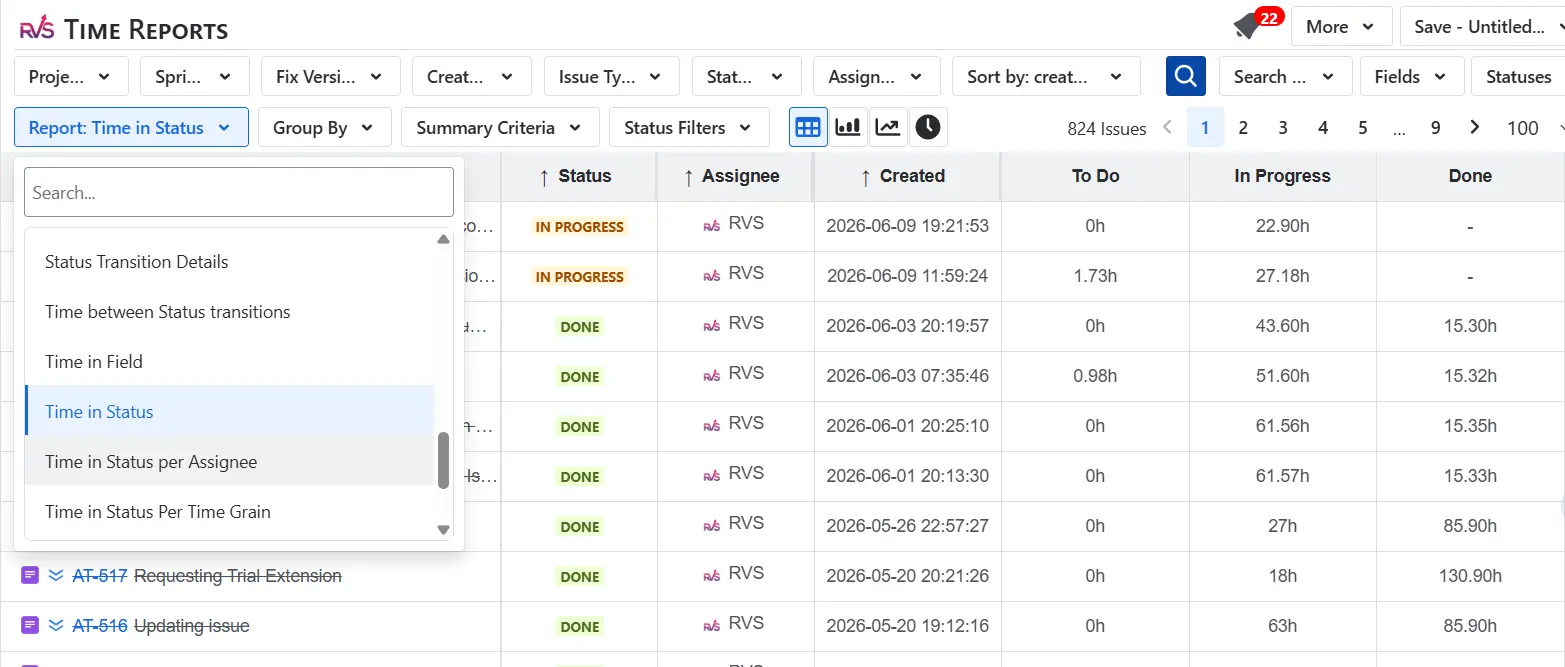
Open the plugin and select Time in Status from the report types
Select your project and apply filters — issue type, assignee, date range, or a saved JQL filter
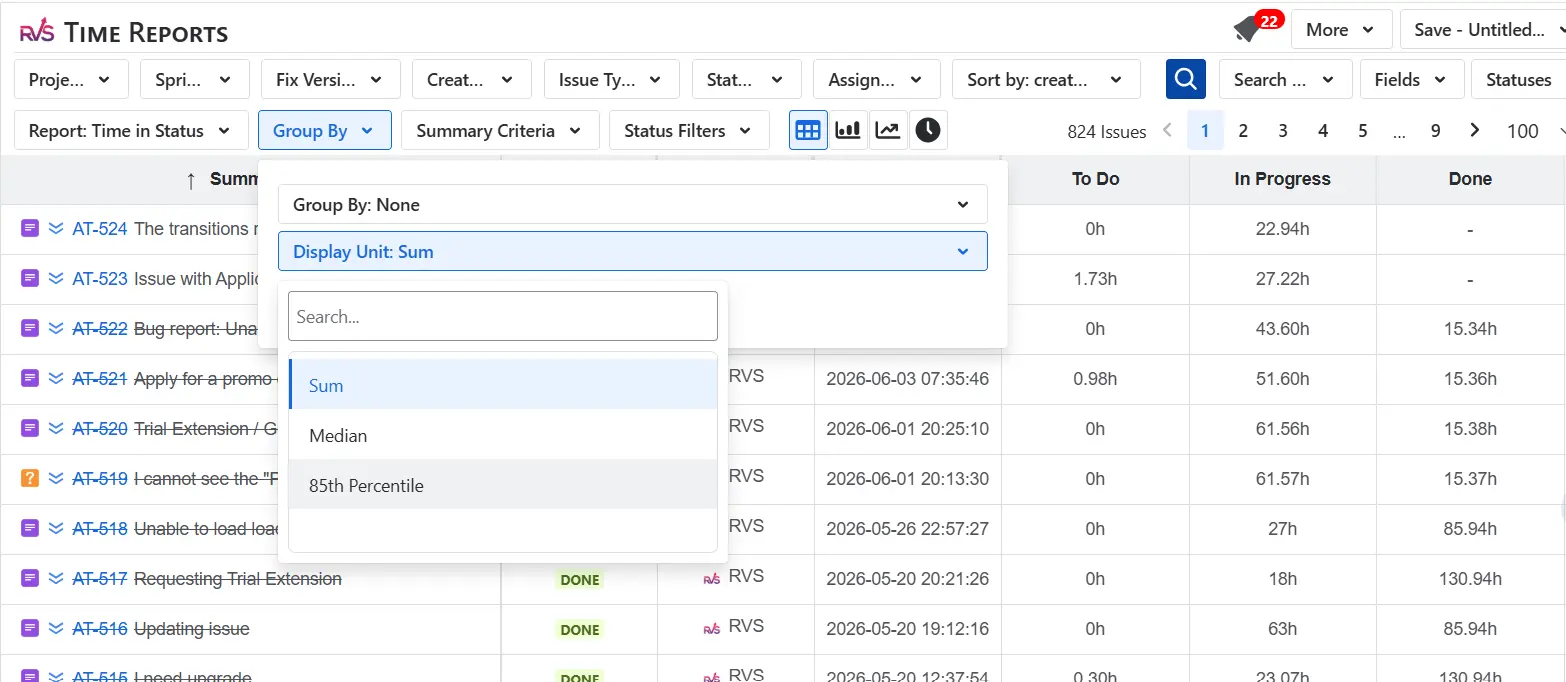
Choose your Group By setting (by status, assignee, or issue group depending on what you want to analyze)
Change the Display Unit to 85th Percentile
Run the report, and each status now shows the 85th percentile duration based on your filtered data
(Optional) Save the report or pin it as a dashboard gadget for sprint review-ready visibility
Conclusion
The difference between a sprint review that drives improvement and one that repeats the same frustrations comes down to visibility.
Jira already captures the data. The challenge is turning it into actionable insights. By analyzing the 85th percentile at the status level, teams can pinpoint bottlenecks, track workflow trends, and focus on the issues that have the biggest impact on delivery.
With the Time in Status Report by RVS Softek, teams can easily see where work slows down, identify recurring delays, and make sprint reviews more objective, focused, and productive.
The next sprint review is an opportunity to stop guessing and start improving.
Frequently asked questions
What does the 85th percentile mean in Jira workflow reporting?
The 85th percentile, meaning in a Jira context, is straightforward: if your 85th percentile for a given status is 3 days, it means 85% of issues passed through that status within 3 days, under real working conditions. It is a more reliable benchmark than averages because it is not distorted by extreme outliers. For sprint reviews, it gives teams a concrete threshold to measure against. Any issue that exceeds it is a confirmed delay, not a subjective impression.
What is the 85th percentile speed, and why does it matter for Scrum teams?
85th percentile speed refers to the delivery pace your team can sustain for 85% of issues, the realistic throughput ceiling under normal conditions, not ideal ones. For Scrum teams, it matters because it sets a defensible benchmark for sprint planning and review. If your 85th percentile cycle time is 6 days, committing to a story on Day 7 of a 10-day sprint is a planning risk, not an optimistic bet. It turns capacity decisions from gut feel into data-backed commitments.
How is the 85th percentile different from the average cycle time?
Average cycle time is pulled by outliers. One issue that took three weeks can make the whole sprint look worse than it was. The 85th percentile is resistant to that distortion. It represents what the workflow consistently delivers for the vast majority of work. For sprint review purposes, it is a more honest signal: it tells you what is normal for your process, and anything above it is genuinely worth investigating.
Does native Jira show 85th percentile data by status?
Native Jira does not provide 85th percentile breakdowns by status. The built-in control chart offers basic cycle time visibility, but it does not surface percentile thresholds per workflow stage. To get 85th percentile data at the status level, the granularity you need for meaningful sprint reviews, you need a dedicated Time in Status plugin like RVS Time in Status Reports.
Recent Blogs
July 23, 2026
Jira Time in Status Report: Complete Guide for Project Managers