The Problem: Jira has plenty of data, but most teams struggle to turn it into clear, decision-ready insights as projects, stakeholders, and reporting needs grow.
The Shift: Advanced Jira reporting focuses on structured visibility using a 3-layer model, better metrics, JQL-driven data, and cross-project dashboards.
The Fix: Build focused dashboards for individual, team, and executive levels. Use the right metrics, clean JQL filters, and plugins to fill gaps in time tracking, workflow analysis, and SLA reporting.
Keep reading to learn how to design smarter Jira reports, choose the right metrics, and build dashboards that actually drive decisions.
Jira stores more reporting data than most teams ever use. The real challenge is not access to data. It is turning that data into useful decisions.
Basic Jira reports work well in the early stages. But as teams grow, reporting gets harder. Work spreads across projects, stakeholders need clearer updates, leadership wants trend-level visibility, and support teams need SLA-focused reporting. That is when basic reports stop being enough.
In 2026, teams need Jira reports that go beyond sprint charts and simple dashboards. They need visibility into delivery health, team performance, workload balance, cross-project risk, executive trends, and service quality.
This guide explains how to approach advanced Jira reporting with the right metrics, dashboards, advanced roadmaps(plans), JQL filters, JSM reporting, and plugins that fill native gaps. It is built for PMs, engineering leads, scrum masters, and Jira admins.
What Is Jira Reporting?
Jira reporting is the process of collecting, visualizing, and analyzing project data in Jira to track team performance, sprint progress, issue trends, and delivery health across individual, team, and leadership levels.
Teams usually rely on three reporting sources in Jira:
Built-in Jira reports for standard agile and operational visibility
Dashboard gadgets for custom views built from saved filters
Third-party apps for deeper time tracking, SLA visibility, and workflow analysis
Advanced reporting matters more now because Jira environments involve more teams, more projects, and more stakeholders. As work scales, teams need reporting that supports decisions, not just updates.
The 3-Layer Jira Reporting Model
Knowing where Jira reports come from is only the first step. The next challenge is deciding how to structure them. Most teams do not struggle because Jira lacks data. They struggle because their reporting is mixed together.
Individual work metrics, team delivery metrics, and leadership-level insights often end up on the same dashboard, which makes reporting harder to read and less useful. That is why it helps to think about Jira reporting in three layers. Each layer serves a different audience, answers different questions, and needs different types of visibility.
Layer 1 — Individual: This layer is for developers, QA teams, and contributors. The focus is on workload, issue age, personal queues, and unresolved work.
Layer 2 — Team: This layer is for scrum masters, project managers, and delivery leads. The focus is on sprint progress, cycle time, burndown, backlog growth, and team throughput.
Layer 3 — Executive: This layer is for leadership and stakeholders. The focus is on release predictability, portfolio risk, dependency impact, capacity, and cross-project delivery trends.
Most teams already use Jira reports at Layer 1 and Layer 2. Very few build Layer 3 Jira reports properly. That is where reporting becomes strategic. This model helps you decide what each dashboard should include and who it is meant to serve.
The Right Metrics for Each Reporting Layer
Once the 3-layer model is in place, the next step is choosing the right metrics. This is where many teams go wrong. They either track too much or show the same metrics to everyone.
Layer 1: Individual Metrics
Issue age shows how long the open work has remained unresolved
Time logged vs estimated shows whether estimates and effort are aligned
Reopened issues can signal incomplete work or weak acceptance criteria
A reliable Jira time tracking report is especially useful here because it adds effort visibility to issue tracking.
Layer 2: Team Metrics
Sprint velocity shows how much work a team completes per sprint
Cycle time shows how long it takes for work to move from active progress to done
Burndown rate shows whether sprint work is moving on pace
Created vs resolved ratio shows whether backlog volume is growing
These are often the most useful Jira reporting options for tracking team performance at the team level.
Layer 3: Executive Metrics
Leadership usually needs fewer metrics, but better ones:
Release predictability
Cross-project throughput
Blocked issue rate
SLA compliance for service environments
The rule is simple: choose two or three metrics per layer. Too many Jira reports create noise. The right Jira reports create decisions.
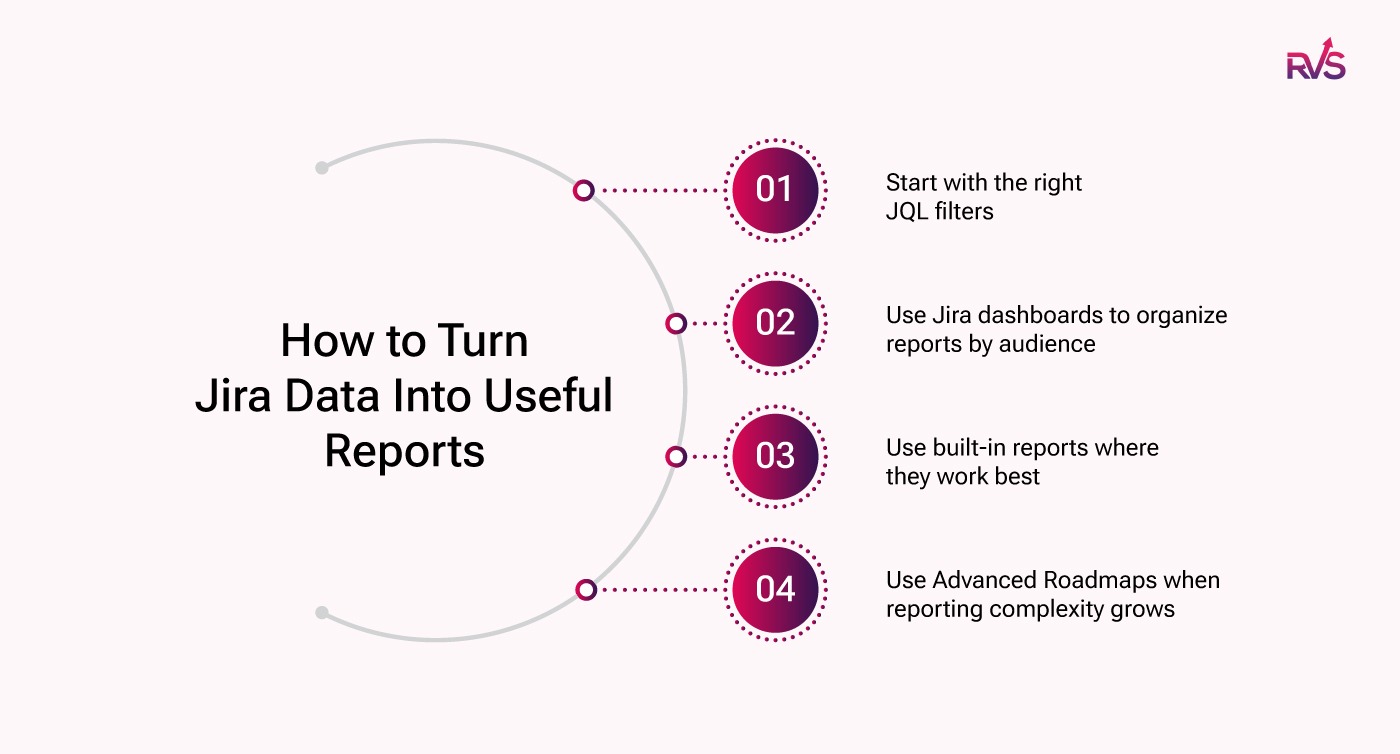
How to Build Better Jira Reports
Once you know what each layer should track, the next step is building reports that are actually useful. Good Jira reporting follows a simple path: define the right data, show it to the right audience, and use the right reporting method for the level of visibility you need.
Start with the right JQL filters
Every useful Jira report starts with a clear data set. Before building dashboards or charts, teams need to define exactly what they want to measure. This is where JQL helps. It lets teams narrow Jira data into focused views, whether that means unresolved issues, high-priority bugs, or work completed in a specific period.
Use Jira dashboards to organize reports by audience
Dashboards should reflect the 3-layer model. Layer 1 dashboards work best for personal workload and issue-level visibility. Layer 2 dashboards should focus on sprint health, throughput, and backlog movement. Layer 3 dashboards should highlight delivery trends, risk, and release visibility for leadership.
Use built-in reports where they work best
Jira’s native reports are still useful, especially for team-level reporting. Velocity charts, burndown reports, sprint reports, and created-versus-resolved views can answer many day-to-day delivery questions without extra setup.
Use Advanced roadmaps when reporting complexity grows
As reporting expands across multiple teams, projects, timelines, or dependencies, standard dashboards start to fall short. That is where advanced roadmaps become useful. It helps teams build a broader reporting view for cross-team progress, capacity, and delivery risk.
The goal is not to create more reports. It is to create Jira reports that are focused, relevant, and easy to act on.
JQL Cheat Sheet for Advanced Reporting
Every advanced dashboard starts with a filter. Good JQL makes Jira reports more focused, reusable, and easier to maintain.
Backlog health project = "YourProject" AND resolution = Unresolved AND created <= -30d ORDER BY created ASC
Cross-project high-priority view project in (ProjectA, ProjectB, ProjectC) AND priority = High AND status != Done
Critical bug age resolution = Unresolved AND created <= -14d AND issuetype = Bug AND priority in (High, Critical)
Team workload snapshot assignee in membersOf("your-team") AND status = "In Progress" ORDER BY assignee
Quarterly resolution tracking project = "YourProject" AND status changed to Done DURING ("2026-01-01","2026-03-31")
Save these as shared filters and connect them to dashboard gadgets. This is one of the easiest ways of generating reports in Jira without repeating the same query work every time.
Cross-Project and Executive Reporting
Single-project reporting stops being enough once teams manage several active projects at the same time. Delivery managers and leadership need cross-project Jira reports that unify work into one view.
The cleanest approach is to build a Jira executive dashboard with shared filters and a small set of high-value gadgets. Use the top row for health signals such as overdue issues, blocked issues, or critical bugs. Use the lower section for trends such as throughput, created vs resolved, and resolution time.
Executives usually do not care about the sprint burndown. They care about questions like:
Are releases likely to ship on time?
Is throughput improving or slowing down?
Where is delivery risk rising?
Which teams or projects need attention?
That is the difference between operational dashboards and executive Jira reports.
JSM Reporting and SLA Visibility
Jira Service Management reporting is different from software delivery reporting. The focus shifts away from sprint speed and toward service quality, response performance, and compliance.
The four JSM reports most teams need are:
SLA breach report
Queue performance report
CSAT report
Ticket volume and trend report
Among these, SLA reporting is often the most important. Support leaders need fast visibility into response-time targets, resolution targets, and tickets that are close to breaching.
The SLA Dashboard Gadget for Jira fits naturally here. It helps teams surface SLA status through dashboard gadgets, filter SLA data with JQL and standard Jira fields, and monitor at-risk or breached issues in real time. That makes SLA-focused Jira reports more actionable for service desks and support leaders.
A simple executive JSM dashboard can often be built around just two numbers: SLA compliance percentage and ticket volume trend.
Common Jira Reporting Mistakes to Avoid
Most Jira reporting problems are not technical. They happen when teams rely on basic reports for needs that have already outgrown them.
Common mistakes include:
Tracking too many metrics
Letting dashboards go stale
Having no ownership of shared filters
Using sprint dashboards as executive reports
Ignoring time data
These are clear signs that native Jira reporting is no longer enough. As reporting becomes more detailed and cross-functional, teams often need added reporting depth.
That is where Jira reporting plugins by RVS Softek can help. They extend native Jira reporting with more useful visibility for time, workflow, agile delivery, and service performance.
Beyond Native Jira: RVS Softek Plugins for Advanced Reporting
Jira’s native reports cover the basics well, but reporting needs often grow faster than native features. That is where RVS Softek comes in.
RVS Softek builds Jira apps that help teams go deeper into reporting, especially when they need better time visibility, clearer workflow analysis, and stronger agile insights.
Each plugin solves a different reporting gap in Jira.
Worklog Time Tracking & Timesheet helps teams turn raw time logs into cleaner, more usable reports. Instead of reviewing time entry issue by issue, teams can view time by user, project, team, or date range. This makes timesheet reporting easier for managers, delivery leads, and teams that need better effort visibility.
Time in Status Reports helps teams understand how long work takes in each workflow stage. Instead of only knowing when an issue was completed, teams can see how long it stayed in review, testing, blocked, waiting, or approval states. This makes Jira reporting more useful for spotting bottlenecks, improving cycle time, and finding slow points in delivery.
Agile Tools helps teams expand reporting beyond basic single-team views. It supports broader agile visibility, which is useful when teams need more reporting depth across workflows, projects, or delivery processes.
Conclusion
Advanced Jira reporting is not about building more dashboards. It is about showing the right insights to the right people at the right time. Once native reports stop giving you the visibility you need, the next step is to strengthen your setup with the right reporting tools.
If you want deeper, more actionable Jira reporting, book a demo with RVS Softek and see how the right Jira reporting plugins can help your team report better.
Ready to optimize your project management and improve your team's performance?
Advanced Jira reporting refers to generating detailed insights from Jira data beyond basic reports. It helps teams analyze workflow performance, issue cycle time, team productivity, and project progress using customized dashboards and reports.
2. Why do teams need advanced Jira reports?
Teams need advanced Jira reports to gain deeper visibility into project performance. These reports help identify bottlenecks, measure team efficiency, track workflow delays, and support data-driven decision making.
3. What metrics should be included in advanced Jira reports?
Common metrics used in advanced Jira reports include cycle time, lead time, time in status, issue resolution time, sprint velocity, workload distribution, and status transition frequency.
4. What are the limitations of native Jira reports?
Native Jira reports provide basic insights like sprint burndown and velocity charts. However, they often lack advanced workflow analytics, detailed time tracking, customizable reporting, and cross-project reporting capabilities.
5. How can teams generate advanced reports in Jira?
Teams can generate advanced Jira reports by using Jira dashboards, exporting data for analysis, or installing Jira reporting plugins that provide deeper workflow analytics and customizable reporting options.
6. What is the best way to track time across Jira workflows?
The best way to track time across Jira workflows is by using tools that analyze how long issues stay in different statuses. This helps teams understand workflow efficiency and identify delays in development or review stages.
7. How do advanced Jira reports improve team productivity?
Advanced Jira reports improve productivity by highlighting workflow bottlenecks, helping teams optimize processes, balance workloads, and track project progress using real performance data.
Recent Blogs
June 29, 2026
Timesheets for Employees in Jira: How to Track Time Without Any Automation