The Problem: Jira handles core workflows well, but sprint velocity only tells you what got done, not why it took so long. Time in status reports fills that gap.
The Shift: High-performing Jira teams don't just track velocity. They layer in time in status reports to diagnose exactly where issues stall.
The Fix: Use time in status reports in Jira to expose bottlenecks, validate cycle time, track SLA performance, and spot systemic slowdowns before they become incidents.
Keep reading to: Understand the 7 specific insights sprint velocity will never surface, and how the right Jira plugin makes them visible from day one.
Sprint velocity is useful for measuring output. It tells you how many story points were completed in a sprint and whether delivery is moving faster or slower over time. But velocity only shows the final number. It doesn’t explain what happened inside the sprint to produce that outcome.
Two teams can report the same sprint velocity while working very differently behind the scenes. One team may move issues smoothly from development to release. The other may struggle with long review cycles, blocked approvals, constant waiting time, or QA bottlenecks. Velocity hides those details.
That’s where time in status reports becomes valuable.
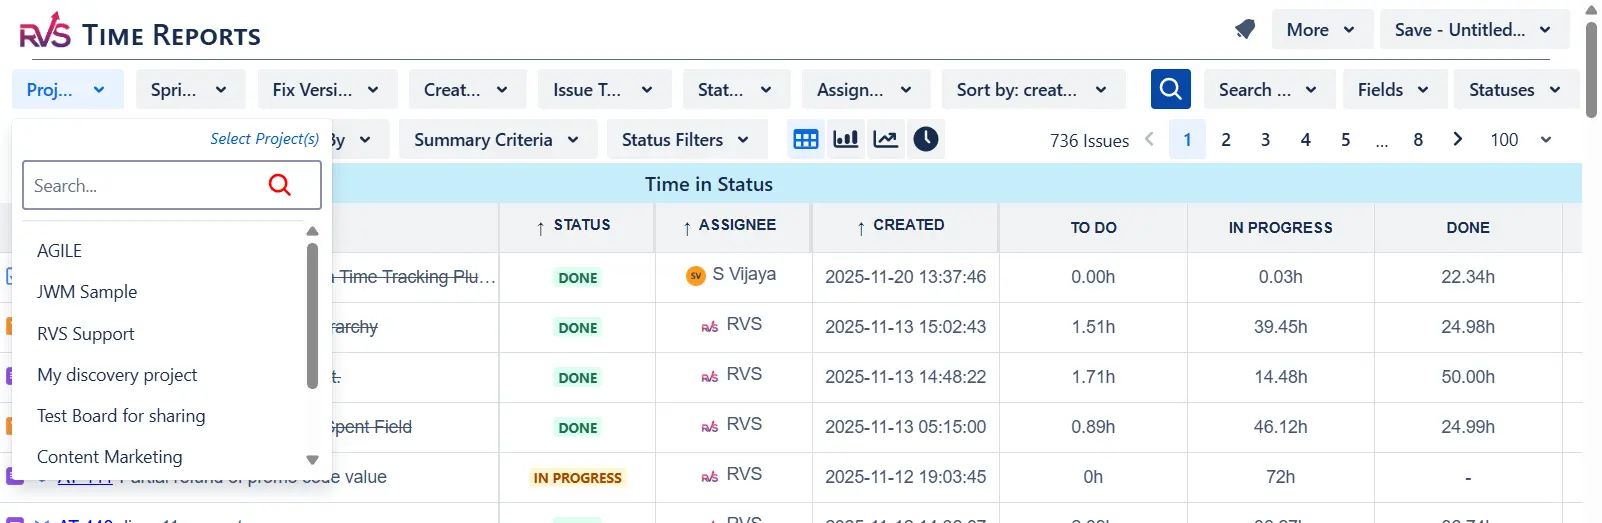
Instead of only tracking completed work, time in status reports shows how work actually flows through your Jira workflow. You can see exactly how long issues stay in statuses like “In Progress,” “Code Review,” “Testing,” or “Blocked,” helping you uncover delays, handoff issues, overloaded stages, and hidden inefficiencies that sprint velocity alone can never reveal.
In other words, sprint velocity tells you how much work was delivered. Time in status tells you how the work moved, and where it slowed down.
Here are 7 things time in status reports can reveal that sprint velocity simply can’t.
7 Things You Can Learn from Time in Status Reports
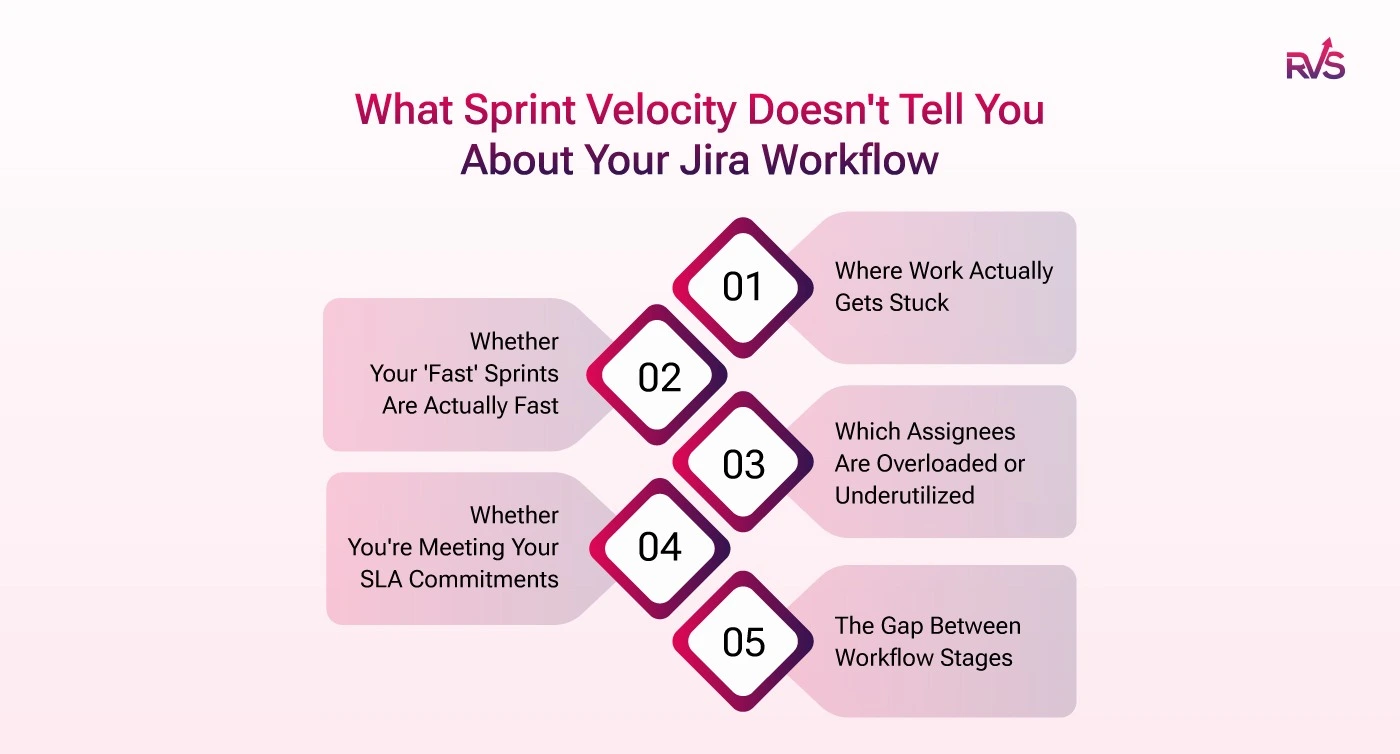
Velocity gives you the scoreboard. Time in status reports in Jira gives you the game tape. Here are the seven insights that live in your workflow data, and that your team is missing without them.
1. Where Work Actually Gets Stuck
Here's an uncomfortable pattern that shows up across Jira-based engineering teams: velocity looks steady while one specific status is accumulating days of idle time per issue. "In Review" is the most common culprit, but "Ready for QA," "Awaiting Approval," and "Ready for Deploy" are close behind.
Teams often discover that 40–60% of an issue's total lifecycle time is spent waiting, not being actively worked. That's not a workload problem; it's a workflow design problem. And it's completely invisible to velocity, which only registers the issue once it hits "Done."
Jira status duration analysis surfaces this at the issue level and in aggregate. You can see which stages consistently accumulate dwell time across your entire backlog, and that's where process intervention actually pays off.
Operational reality:
Code review is one of the most common workflow bottlenecks in
Jira-based engineering teams, not because engineers aren't reviewing,
but because review ownership is unclear and queue depth is invisible
until it's too late.
2. Whether Your 'Fast' Sprints Are Actually Fast
This is the contrarian point most sprint retrospectives skip: a team can post strong velocity numbers while their workflow is quietly deteriorating.
How? Carried-over issues from the previous sprint get closed in the first two days of the next one. Issues pile into the final 48 hours under deadline pressure. The story points close to the velocity number hold, but cycle time has been creeping upward for months.
Cycle time visibility is the correction. It measures the true elapsed time from when work started to when it was completed, independent of sprint boundaries. A team with high velocity but lengthening cycle time is running harder to stand still, and the first sign of that is in the workflow data, not the sprint report.
This is why engineering leaders are increasingly treating cycle time as a primary delivery health metric alongside or instead of velocity. It's a leading indicator. Velocity is a lagging one.
Why is sprint velocity a misleading metric?
Sprint velocity measures the number of story points completed per sprint. It doesn't account for how long issues actually took to move through the workflow, whether work was evenly distributed, or whether the team rushed to close tickets before the sprint end. A team can maintain healthy velocity while cycle time, review lag, and handoff delays are all deteriorating simultaneously.
This is exactly why teams move to dedicated Jira time tracking tools.
Native Jira dashboards surface what has been completed. It surfaces how it moved, and where it didn't. RVS Time in Status Reports is built entirely around that gap.
3. Which Assignees Are Overloaded or Underutilized
Sprint velocity is a team number. It hides individual-level imbalance entirely. One engineer might be clearing issues in two days while another holds tickets in active status for eight. The team number looks fine. The workload distribution is broken.
Assignee-level status duration analysis makes this visible immediately. You can see average time per active status broken down by team member, and when one person's issues consistently take three times longer to move through "In Progress" than everyone else's, that's a signal worth acting on.
Is it the workload? Complexity? Unclear requirements at handoff? Unresolved blockers? The workflow data gives you the question to investigate. Without it, you're waiting for a retrospective that will never surface the issue by name.
4. Whether You're Meeting Your SLA Commitments
For support operations, QA, and ops teams running in Jira, sprint velocity is close to meaningless as a performance metric. SLA adherence is what matters, and SLA adherence is measured in time, not story points.
The standard metrics for SLA evaluation are median resolution time and 85th percentile response time. If your P1 SLA requires resolution within four hours and your actual median is six hours, that's a contractual exposure, and it's invisible until workflow data surfaces it.
Most native Jira dashboards can't expose this level of resolution-time analysis across your issue history. A dedicated Jira SLA reporting layer does, and it converts what is currently an anecdotal sense of "we're usually pretty fast" into a measurable, reportable figure you can take to a customer or stakeholder.
Benchmark insight:
Teams tracking 85th percentile resolution times typically discover that a small number of issue types, often escalations and cross-team dependencies, are responsible for the majority of SLA breaches. Workflow analytics pinpoints them precisely; intuition rarely does.
5. The Gap Between Workflow Stages
Here's a workflow failure pattern that almost never shows up in sprint retrospectives: an issue completes code review, moves to "Ready for Deploy", and then sits there for three days while deployment is queued. No individual stage looks bad. The issue isn't stuck "in" anything. But transition lag has added three days to the lead time.
This is what transition analytics captures: the lag between specific workflow stages. Long transition lag typically increases lead time more than active development time itself, especially in teams with approval-heavy workflows, shared deployment pipelines, or multi-team handoffs.
Velocity doesn't track transitions. It only records the final state. Jira flow efficiency metrics that include transition-level analysis show you where the baton is being dropped, not just which laps are slow.
6. Systemic Slowdowns Before They Become Incidents
Velocity is a lagging indicator. By the time a delivery problem is visible in your sprint output, it has usually been building for weeks in the workflow data. A review stage that was taking two days in Q1 and is now taking four days in Q3 won't show up as a velocity drop until it's severe, but it shows up in cycle-time trend analysis as a clear, steady regression.
Lead time, cycle time, and resolution time trends across multiple sprints or time periods give engineering managers an early warning system that velocity simply can't provide. When "In Code Review" duration is trending upward quarter over quarter, it might mean team growth has outpaced your review capacity, ownership is unclear, or code complexity is increasing. Whatever the cause, you can investigate and act before it becomes a missed release.
This is the difference between workflow governance and reactive sprint management. One prevents incidents. The other responds to them.
7. Whether Your Workflow Is Actually Being Followed
Jira workflows are easy to design. Statuses like "Backlog," "In Progress," "In Review," "UAT," and "Done" look clean and logical on a board. But are they actually being used the way you intended?
Time in status reports reveals the reality of status usage. If 90% of your issues spend zero time in "UAT" before moving to "Done," your UAT stage is being skipped or bypassed. If issues are bouncing repeatedly between "In Progress" and "In Review," there's a quality or handoff problem embedded in your process.
None of this shows up in velocity. But it shows up immediately in time in status reports in Jira, and fixing it has a more lasting impact on delivery quality than pushing the team to close more story points per sprint.
If you want to track issue time across statuses, analyze workflow bottlenecks, monitor SLA performance, compare assignee efficiency, or generate detailed cycle time reports directly inside Jira, tools like RVS Time in Status Reports for Jira
Getting This Visibility in Jira: Try RVS Time in Status Reports
RVS Time in Status Reports is a Jira time tracking plugin built for teams that want visibility into how work actually moves across their Jira workflow.
Instead of only tracking logged hours or sprint completion metrics, the app helps teams measure:
how long issues stay in each status,
where workflow bottlenecks occur,
How much time is spent between transitions?
whether SLAs are being met,
and how efficiently work flows across teams, assignees, and projects.
It transforms raw Jira workflow history into actionable operational insights for engineering, QA, DevOps, support, ITSM, and project management teams.
Here's what you get out of the box:
Time in Status Reports: Pinpoint delays and bottlenecks across your full Jira workflow. See how long each issue spent in every status, broken down by status, assignee, or issue group, with chart views and Power BI export for senior management reporting.
SLA & Percentile Reports: Median and 85th percentile calculations are built in and clearly surfaced, exactly what support and ops teams need to track and report against service levels without digging through a broader analytics platform.
Time Between Statuses: See Jira transition time status, not just dwell time within a status. Find the exact handoff gap where work stalls between stages and address the process break directly.
Trend Analysis: Cycle time, lead time, and resolution time trends over multiple sprints or time periods. Spot systemic slowdowns before they become delivery incidents or stakeholder escalations.
Conclusion
Jira is an exceptional platform, and teams getting the most from it are the ones who've extended it thoughtfully. Sprint velocity has its place — it's a reliable high-level indicator of throughput. But it's a lagging metric. It summarises output; it doesn't diagnose the process.
Time in status reports in Jira is diagnostic. They show you the lifecycle of every issue, the time spent at every stage, and the patterns that emerge across your workflow over time. They answer the questions that actually drive improvement: not "how much did we do?" but "why did it take that long?"
Velocity tells you the score. Time in status reports tell you the game.
If your team runs Jira and doesn't yet have issue time in status reports in its toolkit, the data is already there. You just need a way to surface it. Start with your biggest workflow gap. Find the report that fills it. Then keep building.
Frequently asked questions
What's the difference between sprint velocity and cycle time in Jira?
Sprint velocity measures how many story points a team completes per sprint, it's an output volume metric. Cycle time measures how long it actually takes for a single issue to move from "In Progress" to "Done." A team can have strong velocity and worsening cycle time simultaneously, typically a sign of end-of-sprint rushes, growing review queues, or increasing handoff delays. Cycle time is a flow efficiency metric; velocity is a throughput metric.
How does Jira workflow analytics help with SLA tracking?
Dedicated Jira workflow analytics tools surface median resolution time and 85th percentile completion times, the two standard SLA measurement metrics for support and operations teams. Rather than manually calculating these from exported data, teams can see current SLA performance directly from their Jira workflow history. If a P1 issue type is averaging six hours when the SLA requires four, the gap is visible immediately and traceable to specific workflow stages.
Why can't native Jira dashboards show workflow bottlenecks?
Native Jira dashboards are optimized for issue tracking and sprint progress, not status duration analysis or transition-level workflow intelligence. They show what is open, what is in progress, and what is done. They don't show how long issues sat in each stage, what the transition lag was between statuses, or which workflow stages are consistently slower than others. That level of flow efficiency analysis requires a dedicated Jira workflow analytics plugin.
What is transition lag, and why does it matter?
Transition lag is the time between when an issue leaves one workflow status and when it starts being actively worked on in the next one. For example, an issue might complete code review and move to "Ready for Deploy", then sit there for three days before deployment begins. No single stage looks broken, but three days of lead time have been added invisibly. Transition lag analysis is a dedicated report type in workflow analytics tools and is often the real driver of extended lead times in approval-heavy Jira workflows.
Can Jira workflow analytics tools show trends over multiple sprints?
Yes. Tools like RVS Time in Status Reports track cycle time, lead time, and resolution time trends across multiple sprints and configurable time periods. This trend view is how engineering managers catch systemic slowdowns before they become delivery incidents, a review stage trending from two days to four days over a quarter is a clear signal that would be invisible in a per-sprint velocity chart.
Does RVS Time in Status Reports work with Jira Data Center?
Yes. RVS Time in Status Reports supports both Jira Cloud and Jira Data Center. It installs directly through the Atlassian Marketplace with no external accounts required. All workflow data is processed within your Jira environment; it never reaches a third-party server, making it suitable for teams with strict data residency or compliance requirements.
How quickly can a team start using Jira workflow analytics?
With RVS Time in Status Reports, setup takes under 10 minutes. There is no configuration layer, no parameter sets, and no onboarding session required. Install the plugin through the Atlassian Marketplace, grant the necessary permissions, and your team can run its first status duration analysis on day one. A free trial is available with no credit card required.
Recent Blogs
June 25, 2026
Jira Time Tracker Audit Checklist for Checking Team Worklog Accuracy