Most teams miss sprint commitments because they track Velocity instead of flow. This blog explains how Cycle Time in JIRA exposes bottlenecks, controls WIP, and enables predictable sprint planning. It also shows how Time in Status Report by RVS fills Jira’s visibility gaps to help teams deliver more reliably.
Most Agile teams suffer from a Predictability Crisis.
You plan 40 points, deliver 25, and carry over the rest. The common mistake? Relying on Velocity. Velocity is a lagging indicator—it tells you that you failed, but it never explains why.
If you want to fix unreliable sprints, you have to stop measuring volume and start measuring Cycle Time.
Why Cycle Time is the "Truth" Metric:
It Exposes Bottlenecks: It reveals exactly where work "rots"—usually in QA or Code Review—rather than just showing a ticket is "In Progress."
It Controls WIP: High Cycle Time is a direct result of too much Work in Progress (WIP). When you limit WIP, Cycle Time drops, and predictability rises.
It Sets Reality-Based Deadlines: If your 85th percentile Cycle Time is 6 days, pulling a new story into the sprint on Day 7 is a mathematical guarantee of failure.
However, native Jira doesn’t provide the granular data needed to see where work truly stalls. To transform your workflow, you need a dedicated Jira time tracking plugin like Time in Status Report by RVS.
In this blog, we are going to understand how Time in Status Report Plugin by RVS solves the "visibility gap" by tracking Cycle time in Jira.
How Cycle Time Fixes Unreliable Sprints
Cycle Time provides the clarity needed to identify inefficiencies and delays in your workflow. By measuring how long tasks spend in each status, teams can pinpoint bottlenecks, streamline processes, and create more predictable sprints.
This data-driven approach ensures more accurate planning, better resource allocation, and ultimately, more reliable sprint delivery.
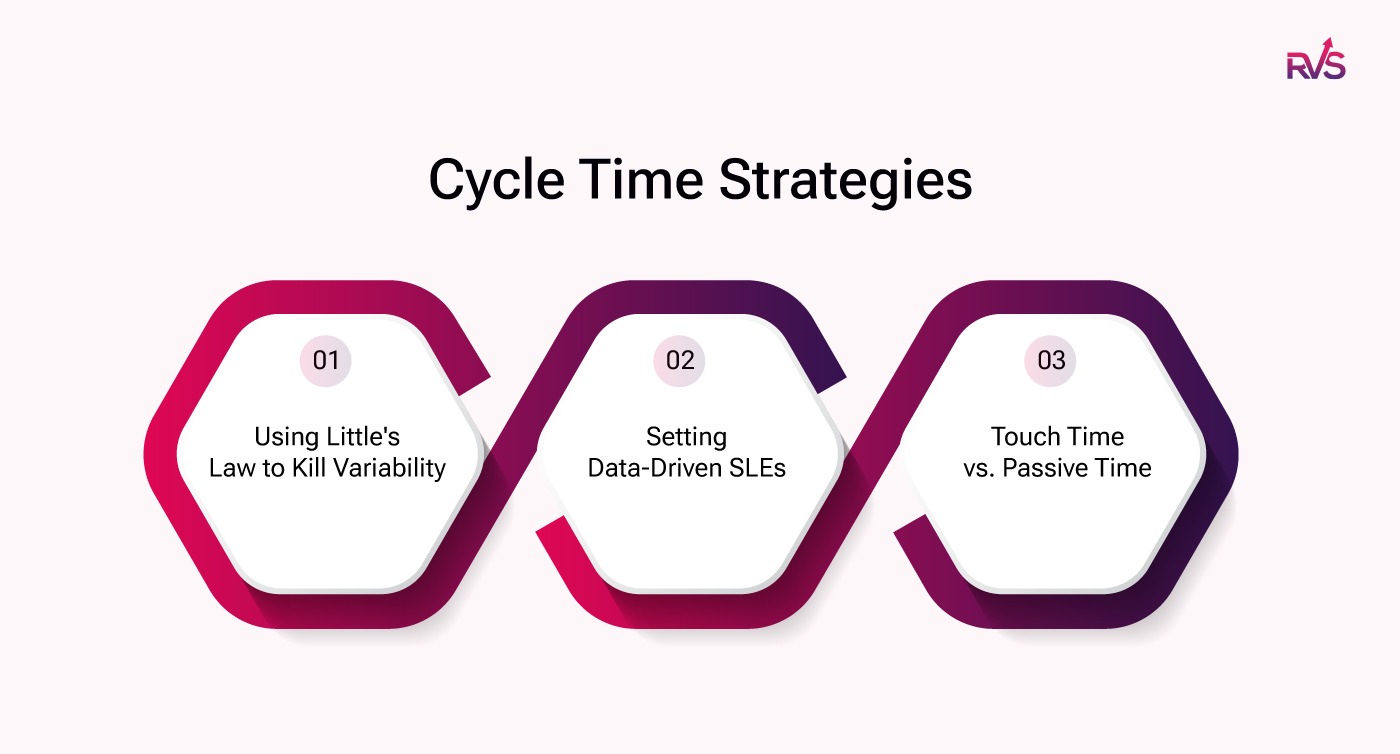
Using Little's Law to Kill Variability
If your sprints feel like a constant scramble, you likely have a WIP (Work in Progress) problem. According to Little’s Law, your average Cycle Time is mathematically tied to how much work you start at once ($Cycle Time \approx WIP / Throughput$).
The Trap: Starting five tasks at once doesn’t mean you finish faster; it means every task sits longer.
The Result: High WIP creates "traffic jams" in your workflow, causing Cycle Time to skyrocket and predictability to vanish.
The Fix: By aggressively limiting WIP, you force work to move through the system faster. Lower WIP = Lower Cycle Time = Higher Predictability.
Setting Data-Driven SLEs
Stop planning sprints based on "gut feelings" or best-case scenarios. Service Level Expectations (SLEs) use your historical Cycle Time to create a protective boundary around your commitments.
Historical Accuracy: If your data shows that 85% of your stories finish in 4 days, that is your "probability shield."
Smart Planning: During sprint planning, if you pull in a task that historically takes 6 days on Day 8 of your sprint, you aren't "being ambitious"—you are ignoring the math.
Data vs. Guesswork: Using SLEs turns sprint planning from a hopeful wishlist into a statistical commitment.
Touch Time vs. Passive Time
A ticket might be "In Progress" for five days, but how much of that was actual work? The secret to fixing rollovers lies in the gap between Active Time (touch time) and Passive Time (wait time).
The Bottleneck Reality: In most broken workflows, 70% of a ticket's life is spent in Passive Time—sitting in a "Ready for Review" or "Waiting for QA" queue.
The Cause of Rollovers: These queues are the primary cause of sprint failure. A developer might finish their work in two hours, but the ticket "rots" for two days waiting for a merge.
The Solution: By focusing on reducing Wait Time rather than just working harder, you clear the bottlenecks that cause tickets to roll over at the end of the week.
The key to understanding and improving Cycle Time is visibility into the Jira status transitions of every task. By analyzing how tasks move between statuses, teams can identify the points where delays are occurring and take action to eliminate bottlenecks. This is where the RVS Time in Status Report plugin comes into play.
Introducing Time in Status Report By RVS Softek
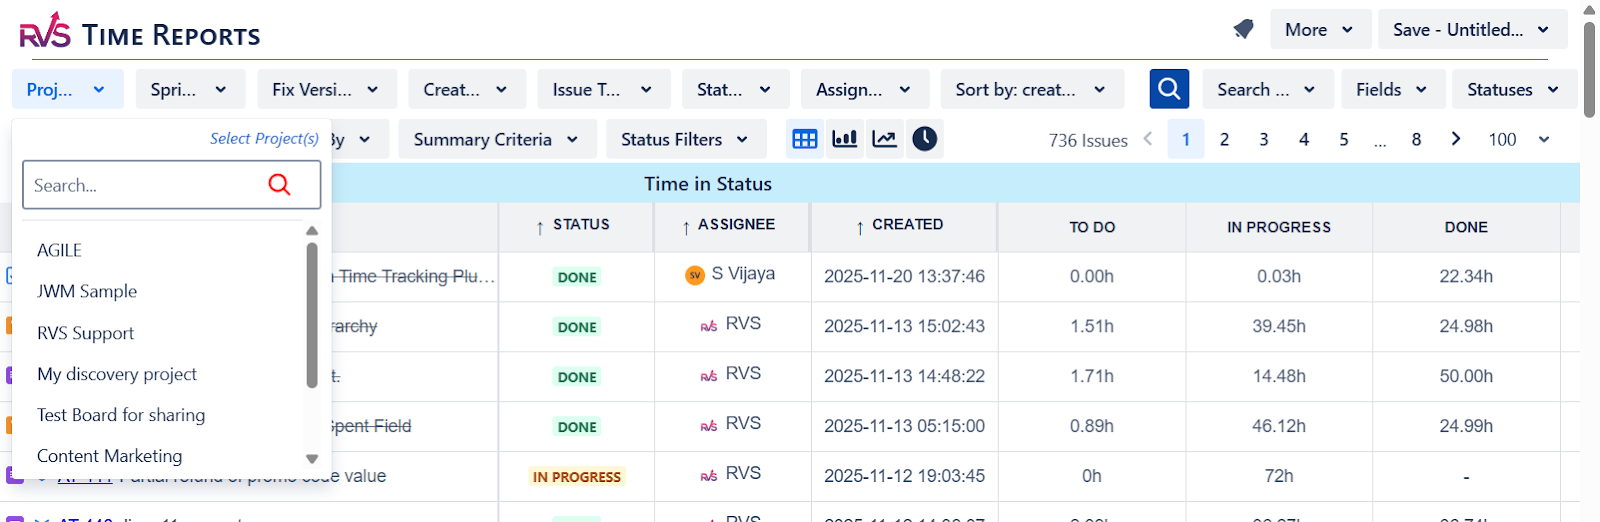
The Time in Status Report Plugin by RVS Softek provides detailed insights into Cycle Time by tracking how long tasks spend in each status throughout your workflow. Unlike native Jira charts, this tool allows you to identify bottlenecks by breaking down task transitions, helping teams pinpoint where delays occur.
With features like real-time bottleneck detection, advanced status grouping, and multi-dimensional reporting, the plugin empowers teams to optimize their Cycle Time, reduce inefficiencies, and enhance sprint predictability. By leveraging this data, teams can make informed decisions to streamline their workflows and improve overall sprint performance.
👉 Explore practical workflows and examples in our detailed Time in Status use casesguide to see how RVS helps teams fix bottlenecks and improve sprint predictability.
RVS Time in Status Report offers a variety of key metrics, enabling teams to track and visualize project data with precision.
How Time in Status Metrics Help Calculate Cycle Time and Fix Unreliable Sprints
The Time in Status (TIS) plugin by RVS provides a range of essential metrics that give deep visibility into your workflow, enabling teams to build an accurate Cycle time report by analyzing how long work spends in each status and identifying the root causes of unreliable sprints.
Here’s how each metric plays a key role in improving sprint predictability:
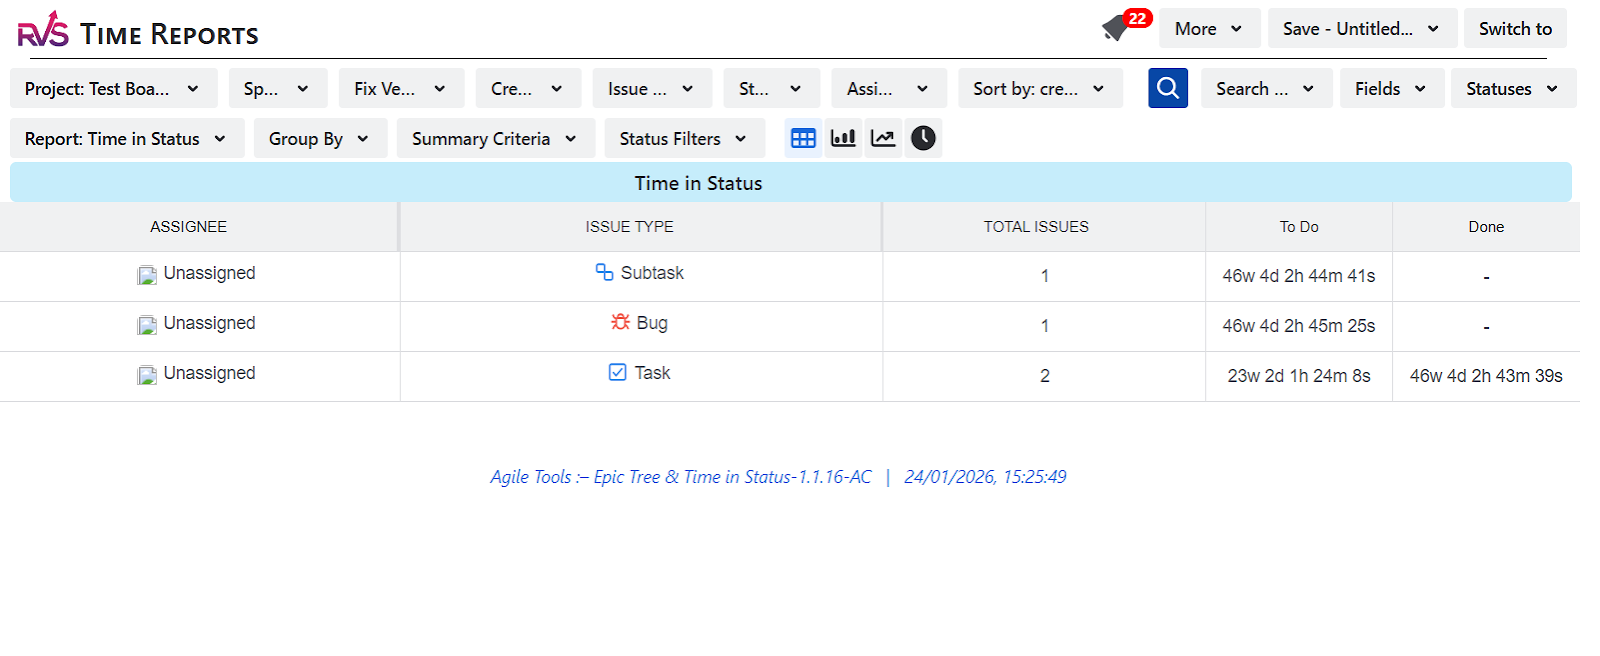
Time in Status (The Core Building Block)
This metric tracks the total time tasks spend in each status of your workflow. By monitoring the time spent at each stage, you can break down your Cycle Time and understand where tasks are delayed. Identifying these delays allows you to optimize the process, minimize waste, and ensure more consistent sprint deliveries.
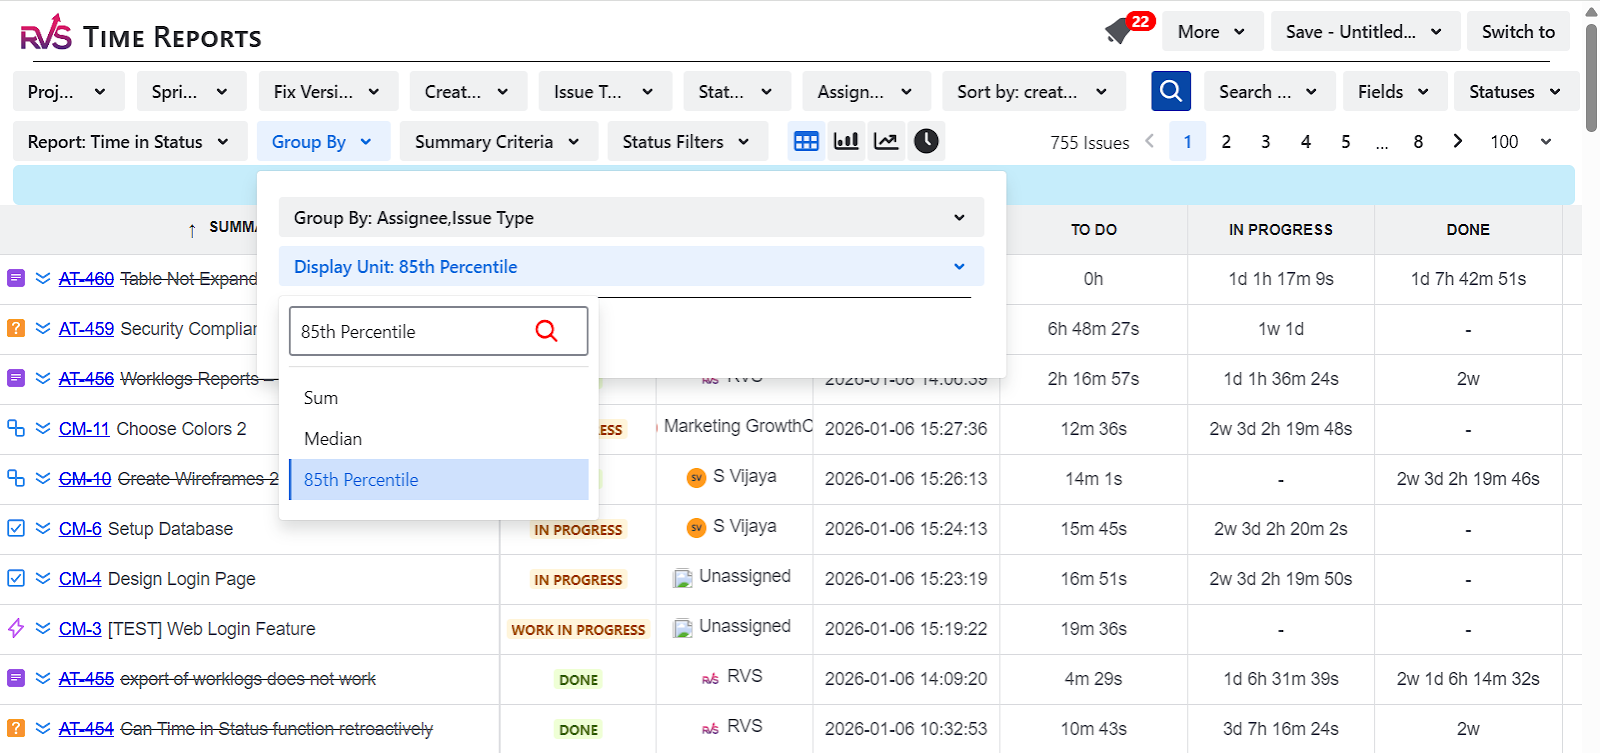
85th Percentile (The Predictability Benchmark)
The 85th Percentile helps set realistic expectations for how long tasks should take to move through each status. By defining the time it takes for 85% of tasks to complete, teams can establish a reliable benchmark for sprint planning and use this data to inform a Cycle time report, enabling more accurate delivery predictions and more consistent sprint outcomes.
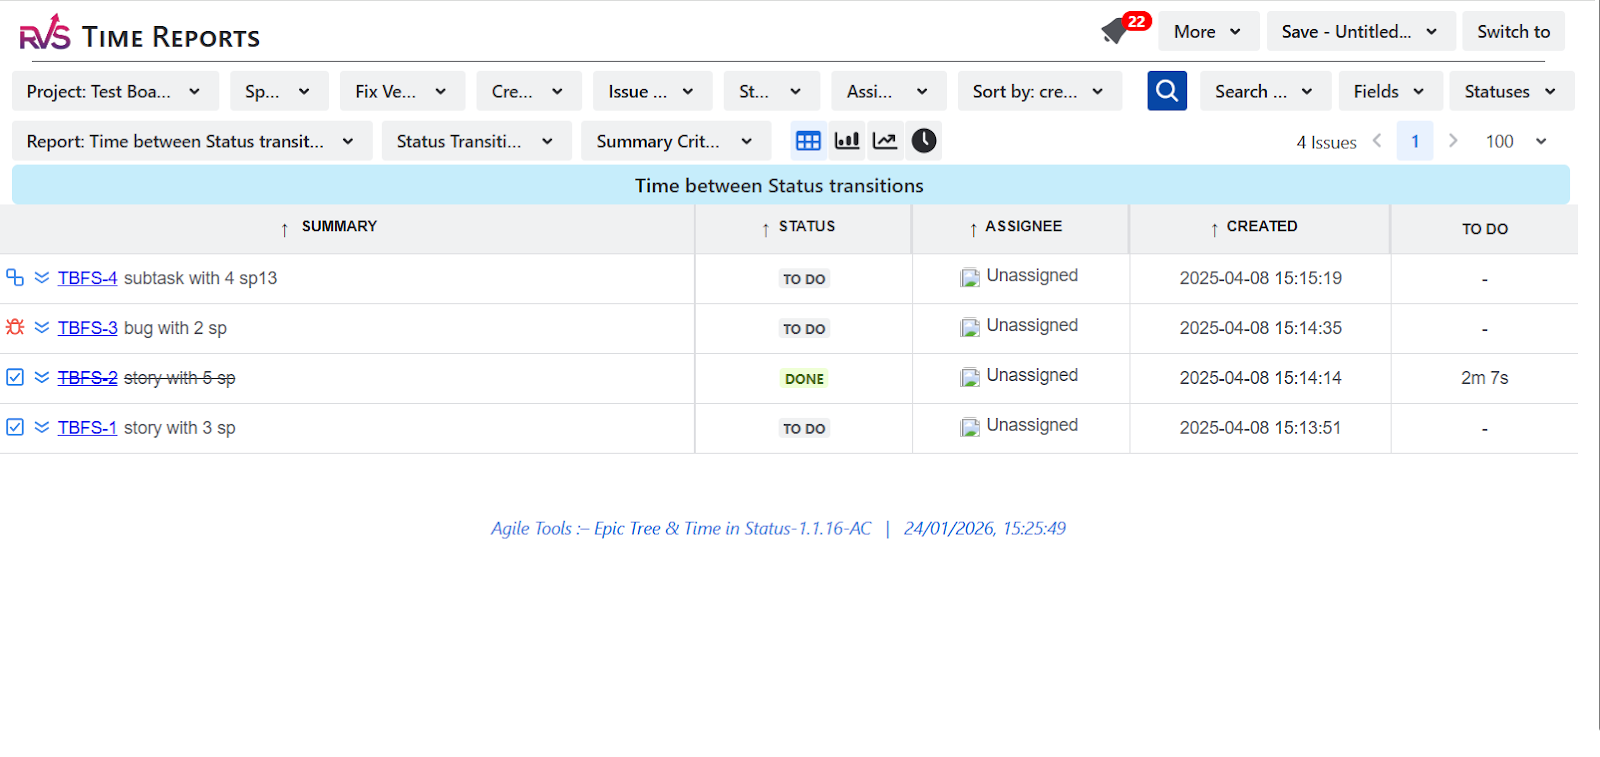
Time between Statuses (To Measure "Passive" Wait Time)
Passive Wait Time refers to the time a task spends idle, waiting for resources or approvals. Tracking the time between statuses helps identify areas where tasks are not actively worked on, often due to bottlenecks or dependencies. By reducing passive wait time, you can improve overall Cycle Time and eliminate unnecessary delays in your sprints.
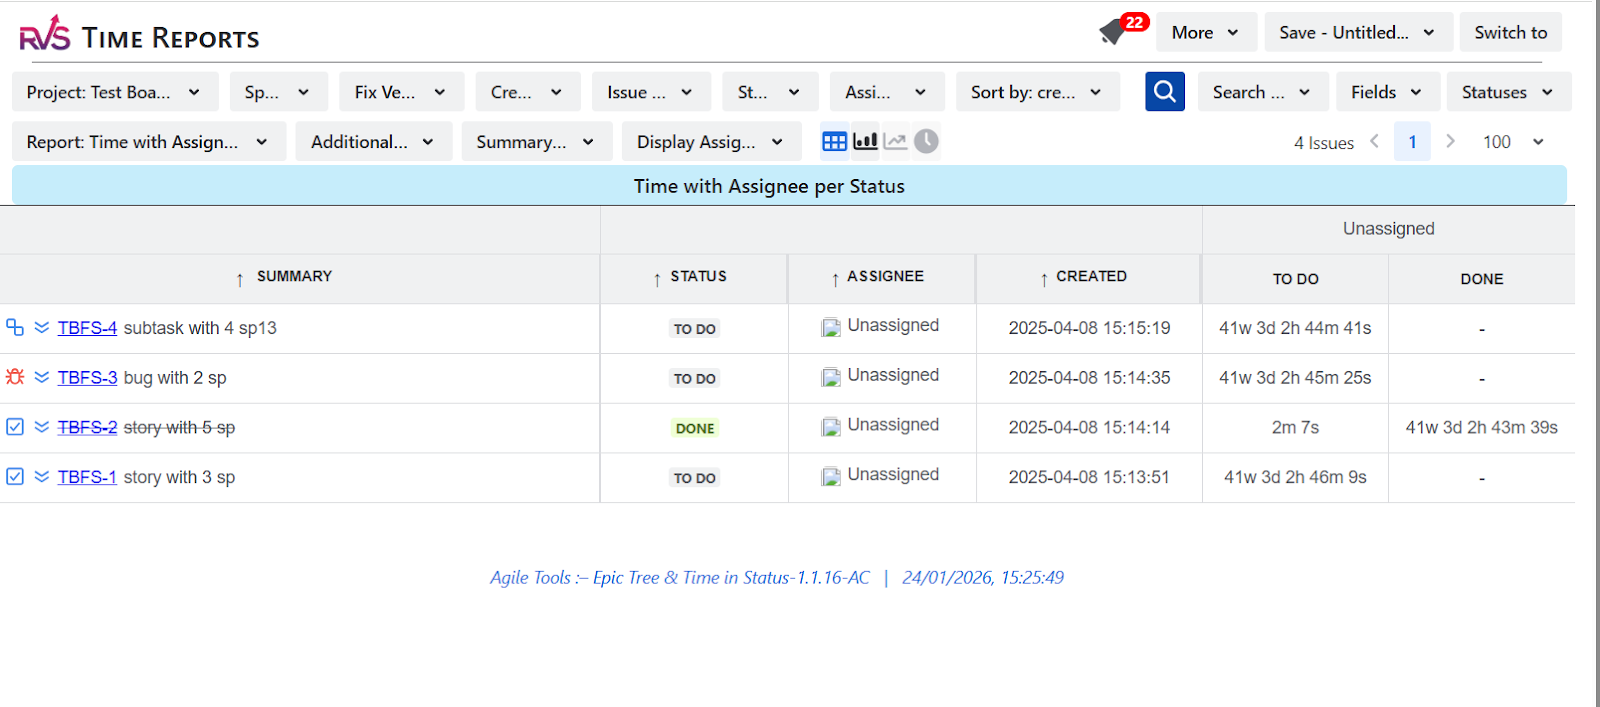
Time with Assignee per Status (To Identify Resource Bottlenecks)
This metric shows the time a task spends in each status with its assigned resource, making it easier to spot resource bottlenecks and inefficiencies. When combined into a Cycle time report, this data helps teams rebalance workloads, shorten Cycle Time, and deliver more predictable sprints.
Time in Status Trends Analysis (To Track Flow Stability Over Time)
Tracking Time in Status trends over time gives you a clear picture of how your workflow is evolving. It helps you spot patterns in Cycle Time, whether tasks are improving in flow or if there are increasing delays. This historical data allows you to make informed decisions about workflow adjustments, ensuring more stable and predictable sprints.
Median (For a Realistic Middle-Ground Baseline)
The Median metric gives a balanced view of Cycle Time, showing the middle point of task durations. This helps avoid overestimating or underestimating task completion times that can happen with averages, providing a more realistic baseline for sprint planning. By relying on the median, you can improve forecast accuracy and align team expectations.
Conclusion
Inaccurate Cycle Time tracking can hinder sprint predictability and workflow efficiency, but with the right tools like Time in Status Report by RVS, teams can uncover key insights into their project performance. By identifying delays, bottlenecks, and resource inefficiencies, teams can refine their planning, improve forecast accuracy, and optimize task flow. These tools don’t just track time; they provide the data necessary for making informed, actionable improvements to sprint delivery.
Cycle Time in JIRA is calculated by tracking how long an issue spends across all workflow statuses from start to completion. Since Jira doesn’t provide this natively, teams use the Time in Status Report by RVS to capture status-level timing and derive an accurate Cycle time report based on real workflow data.
2. How does Cycle Time differ from Velocity in agile planning?
While Velocity measures how much work is completed, Cycle Time tracks how long it takes to complete tasks. Focusing on Cycle Time helps teams improve predictability by identifying delays and streamlining workflows.
3. What is the 85th Percentile, and how does it help in sprint planning?
The 85th Percentile represents the time it takes for 85% of tasks to complete. Using this metric as a benchmark helps teams set realistic deadlines and avoid overcommitting to tasks that may take longer than expected.
4. How can limiting Work in Progress (WIP) improve Cycle Time?
Limiting WIP reduces task congestion and flow disruptions, leading to faster completion times. Lower WIP results in shorter Cycle Times, allowing teams to maintain predictable sprint delivery.
5. What role do Touch Time and Passive Time play in fixing unreliable sprints?
Touch Time refers to the active time spent working on tasks, while Passive Time refers to waiting time in queues (e.g., waiting for review). Reducing Passive Time helps eliminate bottlenecks, improving overall Cycle Time.
6. Why should teams use the Time in Status Report by RVS?
The Time in Status Report by RVS provides granular insights into Cycle Time by tracking how long tasks spend in each status, helping teams identify delays, streamline workflows, and improve sprint predictability.
7. Can historical Cycle Time data improve sprint forecasting?
Yes, historical Cycle Time data allows teams to set Service Level Expectations (SLEs), creating a data-driven approach to sprint planning. This improves accuracy in forecasting task completion and helps avoid over-ambitious commitments.
Recent Blogs
July 9, 2026
Best Jira Time Tracking Apps to Boost Team Productivity (2026)