This blog explains how to transform your retrospectives into data-driven sessions using RVS's Agile Tool plugin. Discover how Agile reports like Time in Status, Worklog Tracking, and Gantt Charts help identify bottlenecks, untracked efforts, and task misalignments, enabling teams to optimize sprint performance with actionable insights.
We’ve all been there: The sprint ends, the goals are missed, and the team gathers for the inevitable retrospective. You ask, "What went wrong?" and get hit with a wave of vague, anecdotal feedback:
"I think we spent too much time on support."
"I didn’t realize that Epic was so massive."
"It just felt like we were spinning our wheels."
The hard truth? Guessing is not a strategy. When retrospectives turn into "feelings sessions," your team walks away without a single actionable insight. You can’t fix a stalled sprint if you can’t see the mechanics of why it stopped.
The Problem: Invisible Friction
Stalled sprints are more than just "stuck tasks." They are the direct result of deep-seated issues that gut feelings simply cannot detect. These hidden forces actively sabotage your progress:
Invisible Friction: Small handoff delays that bleed hours from your timeline.
Broken Hierarchies: Misaligned Epics that paralyze the team with confusion rather than providing clarity.
Unmeasured Effort: The "quick favors" and shadow work that quietly kill your velocity.
If you aren’t measuring it, you aren’t managing it. To stop the bleeding, you must move beyond speculation and deploy precision Agile reports.
Stop Guessing. Start Solving.
While native Jira provides the basics, it often lacks the granular depth needed to diagnose these hidden bottlenecks. This is where Agile tools by RVS Softek step in.
We provide the bridge between "what happened" and "why it happened." In this blog, we’ll explore how RVS tools help you:
Identify Hidden Inefficiencies: Pinpoint exactly where work is pooling.
Expose Structural Bottlenecks: See through the noise of broken hierarchies.
Quantify Unmeasured Effort: Turn shadow work into visible, manageable data.
Let’s dive into how you can transform your retrospectives from guesswork into a data-driven engine for continuous improvement.
The 3 "Invisible" Reasons Your Sprints Stall
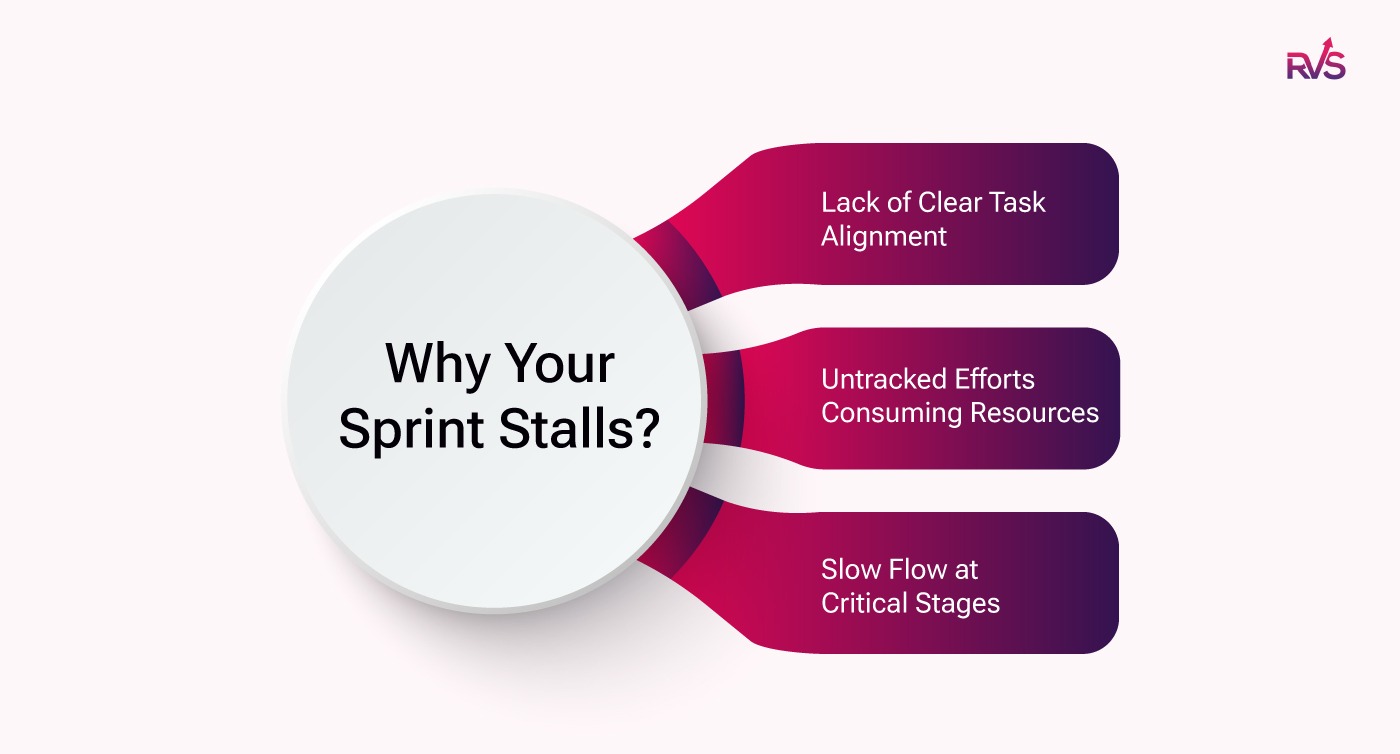
Instead of just looking at "stuck" tickets, we need to dive deeper into the underlying structural failures that cause these problems. There are three major invisible factors that tend to stall Agile sprints:
Lack of Clear Task Alignment: Team members are often working on sub-tasks without fully understanding how their work impacts the larger Epic. When dependencies aren't clearly visible, team members may prioritize tasks in a way that doesn’t align with the bigger picture, leading to misplaced priorities. This lack of context can cause friction that’s not immediately obvious.
Untracked Efforts Consuming Resources: Around 30% of your team's time is often spent on "quick fixes" or minor tasks that aren’t logged. These aren’t part of the sprint plan but still consume significant resources. This leaves the main sprint items starving for time and results in an overall loss of progress. When you can’t track these unlogged efforts, it creates a blind spot in your Agile reporting.
Slow Flow at Critical Stages: Tickets may be moving, but they’re not moving fast enough. The flow of work gets slowed down at specific gates or stages within the process, but no one is measuring this bottleneck. This can cause entire sprints to stall without anyone noticing until the retrospective. Tracking these slowdowns is essential to improving sprint predictability and efficiency.
Turning "I Think" into "I Know" with Agile Gadgets by RVS Softek
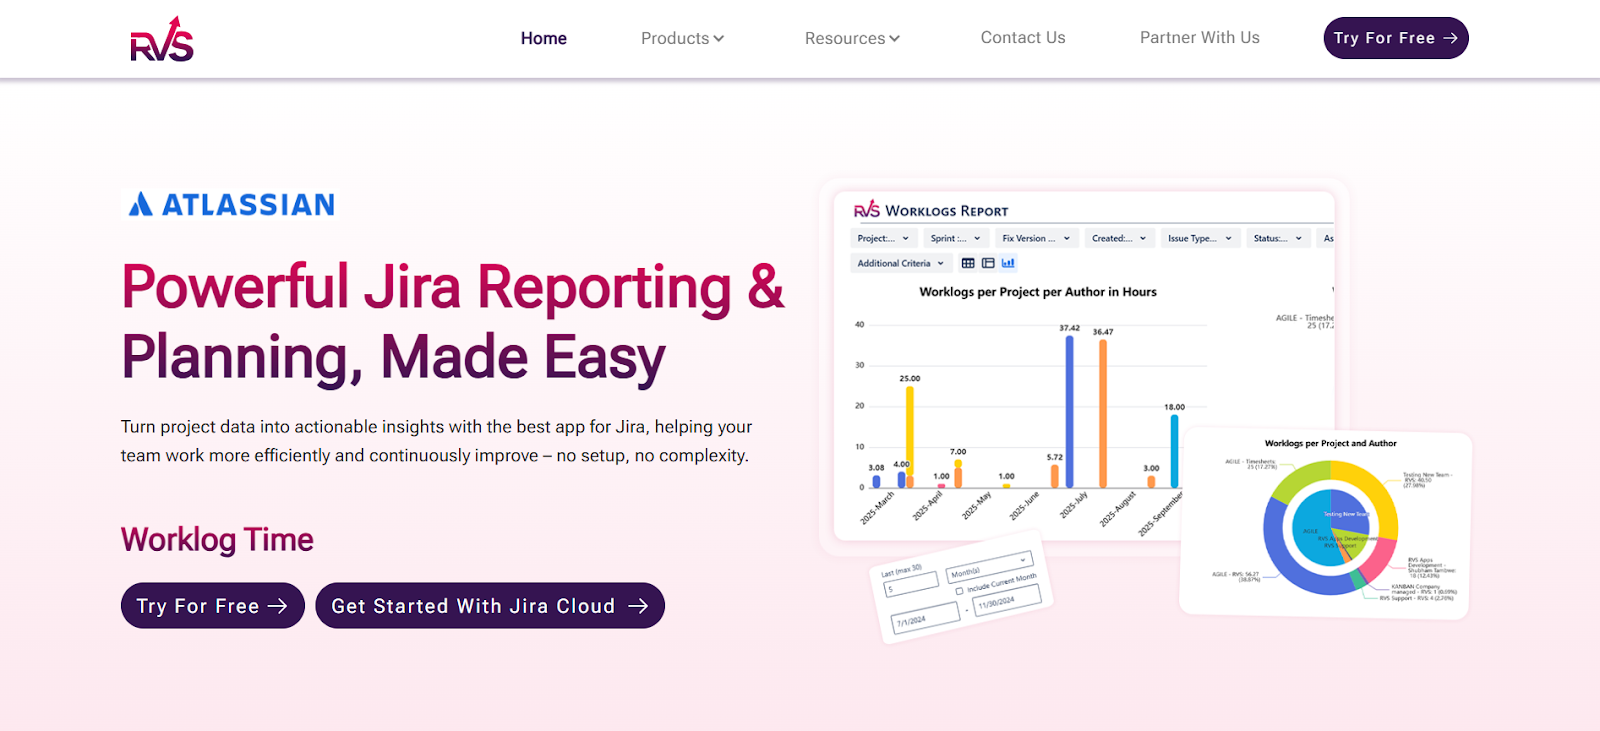
RVS (RVS Softek) is a specialized Atlassian Silver Marketplace Partner that builds high-precision reporting and planning tools for Jira. Their apps are designed to solve the "data gap" in native Jira by providing deep visibility into team flow, resource capacity, and work hierarchies.
The RVS Agile Tools Plugin offers 5 Powerful Jira Agile Tools in One App—Without the Enterprise Cost. This diagnostic toolkit provides you with five distinct "lenses" that help you analyze and improve your sprint workflow.
By combining multiple powerful Agile project management features into one app, you can gain a deeper, data-driven understanding of where your sprint stalled and how to resolve it. These tools empower you to optimize your workflow, eliminate inefficiencies, and ensure your team’s efforts are aligned with your project goals—all without the need for expensive enterprise solutions.
Here are the five features:
Time in Status Report: Tracks the time spent by issues in each workflow status, helping identify bottlenecks and inefficiencies.
Worklog Time Tracking & Timesheets: Allows teams to log and track actual time spent on tasks, providing insights into work effort and accuracy.
Epic Hierarchy: Visualizes the structure of Epics and their linked sub-tasks, helping you manage complex projects and track dependencies.
Link Hierarchy: Displays the relationships between issues, enabling you to see how tasks and dependencies impact the larger project.
Gantt Charts: Provide a visual timeline for tasks and projects, helping teams track progress and plan work effectively across sprints.
Let’s understand these features in detail:
A. Clarity through Hierarchy (Epic & Link Hierarchy)
How it fixes: This feature allows you to visualize your team’s progress in relation to the overall Epic. If an Epic is stalling, you can instantly see which linked dependencies are causing the bottleneck. By mapping out the hierarchy of tasks and dependencies, this Agile reporting tool gives you clarity on exactly where things are getting held up.
Retro Value: With this tool, you can tell your team: "We didn’t finish the Epic because three critical dependencies were blocked three levels deep."
B. Truth through Time (Time in Status & Worklogs)
How it fixes:Time in Status Report and Worklog time tracking & timesheet tool distinguishes between "Work Time" and "Wait Time," making it clear where the time is actually being spent. It helps you pinpoint whether the sprint stalled due to internal inefficiencies or because of external dependencies like feedback or approvals.
Time in Status Report: This feature helps you pinpoint if the sprint stalled because your team was stuck in a particular workflow stage or waiting for feedback.
Worklog Time Tracking & Timesheet: By comparing actual hours spent against estimated points, you can uncover hidden sprints that were happening outside of the planned tasks.
Retro Value: With these reports, you can confidently say: "The sprint stalled because we spent 40 hours on unestimated bugs, not because the development work was slow."
C. Visualizing the Timeline with Gantt Charts
While the other reports tell you how much time was spent or where a bottleneck is, the Gantt Chart shows you the "When." In a retrospective, teams often struggle to remember the sequence of events that led to a stall.
How it fixes: It visualizes the critical path. You can see exactly how a delay in "Task A" pushed "Task B" out of the sprint window entirely.
Retro Value: Instead of saying, "Everything just felt late at the end," you can point to the Gantt Chart and say, "The three-day delay on the API documentation shifted our entire development timeline, causing the Friday bottleneck."
How to Use Agile Reports in Your Next Meeting
Now that we’ve covered how Agile project reporting works and how to leverage the RVS Agile Tools Suite, let’s dive into how you can use Agile reports to run a more effective, data-driven retrospective in your next meeting. Follow these three steps to get actionable insights from your retrospectives:
Step 1: Check Task Alignment with the Link Hierarchy
Start by using the Link Hierarchy to identify if the team got sidetracked by tasks that weren’t aligned with the larger Epic. Were there sub-tasks causing issues or misdirecting focus? This is often where the problem lies.
Step 2: Identify Workflow Bottlenecks with Time in Status
Next, use Time in Status reports to uncover specific stages where the workflow slowed down. Were tickets moving too slowly at a particular gate? Pinpointing these bottlenecks will allow you to take targeted action to improve the flow.
Step 3: Compare Planned vs. Actual Effort with Timesheets
Finally, use Timesheets to compare the planned sprint time with the actual time spent. Were there unaccounted hours? This step helps you identify if the effort was allocated effectively or if resources were misdirected.
Conclusion
Precision Agile reports are a game-changer when it comes to retrospectives. With the right Jira agile reports plugin like the RVS Agile Tools, you no longer have to rely on guesswork to figure out why a sprint stalled. Instead of a "feelings" session, your retrospectives can become a strategic, data-driven exercise.
When you move beyond subjective opinions and focus on real data, you can make actionable decisions that lead to continuous improvement. The insights provided by Agile reporting tools give you a clear picture of your team’s workflow and help you identify areas for optimization.
1. How can Agile reports improve the effectiveness of our retrospectives?
Agile reports provide data-driven insights that help identify exactly why a sprint stalled. With RVS's Agile Tool plugin, you can move beyond guesswork and pinpoint inefficiencies, bottlenecks, and unmeasured effort, transforming retrospectives into actionable strategy sessions.
2. What features of RVS's Agile Tool plugin help identify bottlenecks in our workflow?
The Time in Status report and Gantt Charts are key features in the RVS Agile Tool plugin that allow you to visualize where work is slowing down. These tools help track ticket movement through various stages, allowing you to uncover and address bottlenecks before they derail your sprint.
3. How does RVS's Agile Tool plugin help track hidden or unlogged efforts?
With Worklog Time Tracking & Timesheets in the RVS Agile Tool plugin, you can capture all the unlogged effort—such as quick fixes or shadow work—that is consuming your team’s time. This visibility helps you understand where resources are being misdirected and adjust accordingly.
4. Can RVS's Agile Tool plugin help with understanding task dependencies?
Yes, the Epic Hierarchy and Link Hierarchy features in RVS's Agile Tool plugin provide a clear view of how tasks and sub-tasks are related to larger Epics. This allows your team to see which dependencies are causing delays and helps align work to the overall project goals.
5. How do I measure the impact of external dependencies on my sprint?
The Time in Status report in the RVS Agile Tool plugin helps distinguish between time spent actively working on tasks and time spent waiting for external feedback. This clarity allows you to see how much your sprint is affected by external dependencies and plan accordingly.
6. Can RVS's Agile Tool plugin help improve long-term sprint performance?
Absolutely! By consistently using RVS's Agile Tool plugin to analyze Agile project management data, you can identify recurring inefficiencies and bottlenecks. This helps you make data-driven adjustments that lead to continuous improvement, optimizing future sprints for better performance and predictability.
7. How easy is it to integrate RVS's Agile Tool plugin with Jira?
RVS’s Agile Tool plugin integrates seamlessly with Jira, offering you advanced reporting and visualization tools without the need for complex setups. You can immediately start using the Time in Status, Worklog Time Tracking, Epic Hierarchy, and other features to get deeper insights into your sprint workflow.
Recent Blogs
July 9, 2026
Best Jira Time Tracking Apps to Boost Team Productivity (2026)