This blog explores how the RVS Time in Status Report plugin for Jira helps teams gain valuable insights into their workflow. By tracking time spent across different stages, the plugin enables better decision-making, smoother project management, and more accurate forecasting. We focus on how the average time in status Jira can help identify bottlenecks and optimize processes, leading to improved efficiency and more predictable timelines for 2026.
As 2026 kicks off, teams are diving into the post-holiday rush, with the first quarter already underway. The decorations are down, and so is the comfort of the break. The pressure to hit Q1 goals is higher than ever, but this time, there’s a solution that can make a real difference.
2026 Strategy: This year, it’s not about "trying harder" or scrambling to meet expectations. It’s about "measuring smarter."
One of the biggest hurdles they face is accurately forecasting timelines. Too often, teams operate in the dark, assuming that tasks are progressing smoothly without a clear picture of where time is being lost in the process.
Such a lack of transparency leads to:
Misjudged Deadlines
Unforeseen Delays
Scrambling to adjust mid-project
Ultimately, derailing plans and eroding stakeholder confidence.
Solution: Teams need a tool that gives them visibility into exactly where bottlenecks are occurring
Time in Status report. That’s where the plugin for Jira comes in. It provides key metrics like time in status, time with assignee, and transition time to track how long issues stay in each workflow stage. With these insights, teams can identify bottlenecks, avoid delays, and make informed, data-driven decisions to ensure a realistic and manageable first-quarter roadmap.
In this blog, we’ll particularly focus on the average time in status Jira, understanding how this time-based insight can improve planning and help set more accurate, achievable deadlines.
The Problem: The "Guesswork" Trap
The start of any new year often brings high hopes. But for many project teams, January comes with a heavy burden: estimation debt.
This is the backlog of unfinished tasks that were left incomplete due to poor forecasting or inaccurate estimations carried over from the previous year. It’s a cycle that most teams are all too familiar with, where deadlines are missed, and progress feels more like a stretch goal than a reality.
This estimation debt stems from a fundamental problem: guesswork.
When teams rely on "gut feelings" or vague historical averages to project timelines, they inevitably fall short. For example, teams might look at their Velocity, a metric that measures how much work a team can complete within a sprint, but fail to take into account the cycle time. Velocity might be high, but if your cycle time is consistently longer than expected due to bottlenecks or waiting periods, then that high Velocity is irrelevant.
Story Points vs. Reality
Let’s face it—Story Points only tell half the story. While they’re great for estimating complexity and effort, they don’t account for the underlying cycle time issues that impact your team’s ability to meet deadlines. Without a clear understanding of the average time in status Jira, it’s easy to misinterpret how long it actually takes to get from one stage to the next.
For instance, your team is building a new "Login with Google" button.
Estimate: 3 Story Points (The team thinks it's a medium-sized task).
Expectation: It should be done in about 3 days.
Here is what actually happens:
Status
Time Spent
The Reality
In Progress
1 Day
The developer finished the code quickly
In Review
4 Days
The code sat waiting for a senior Dev to look at it.
In testing
3 Days
The tester found a tiny bug and had to wait for a rebuild.
Done
Total: 8 Days
If you only looked at Story Points, you would see a 3-point ticket that took 8 days. You might think, "Wow, the developer is slow," or "We underestimated the complexity."
But by looking at Time in Status, you see the truth:
The developer was actually fast (1 day).
The process was slow (4 days waiting for review).
The real issue arises when estimates fall short and missed deadlines affect stakeholders. "Gut-based" roadmapping leads to a lack of transparency, damaging trust. Instead of explaining why deadlines are missed, teams end up apologizing. Predictability is key, and it all comes down to accurate data. This is where the average time in status Jira becomes crucial.
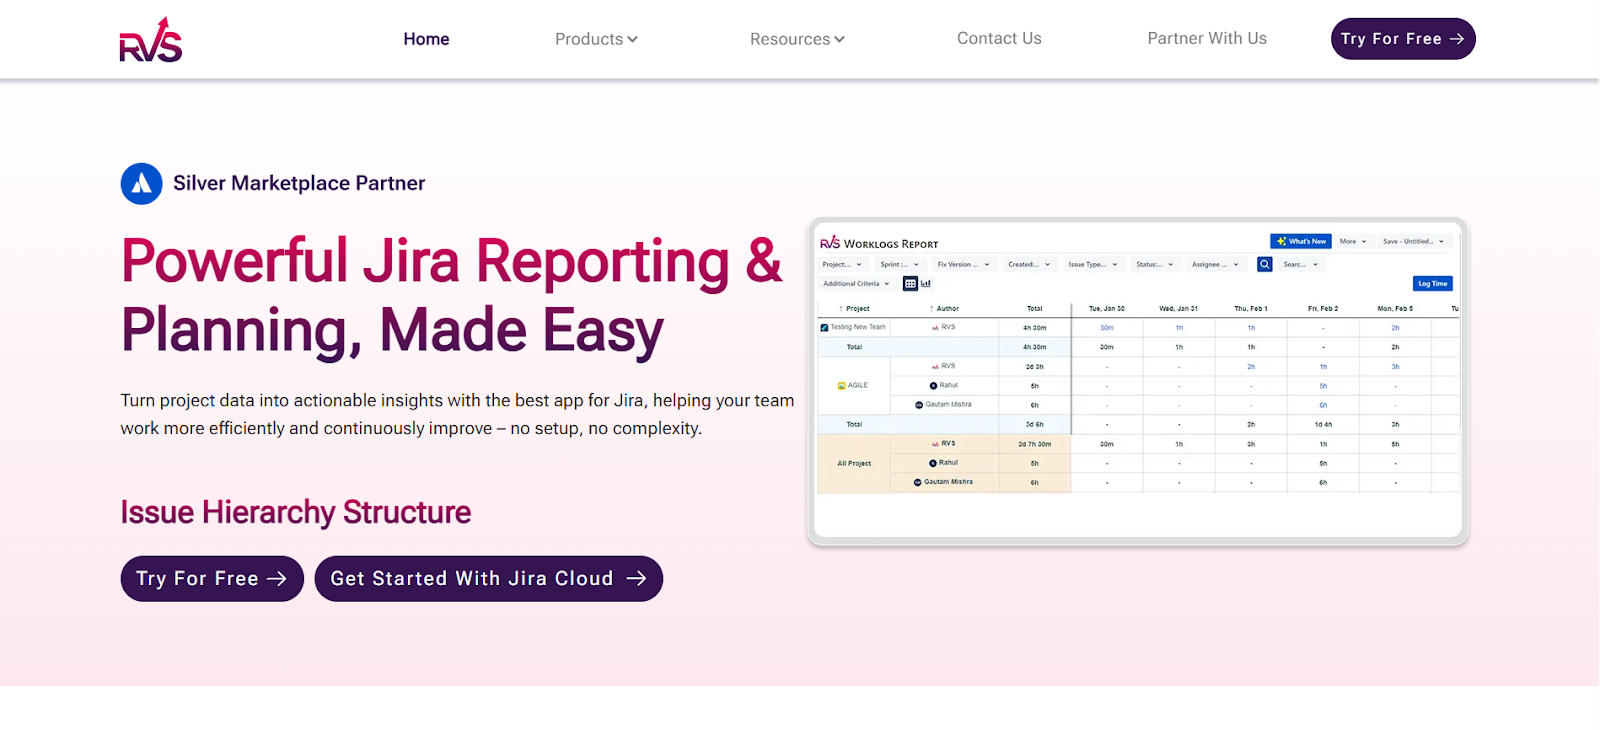
To fully leverage Jira Time in Status, you need the right plugin. The RVS Time in Status Report plugin is the perfect solution, offering advanced tracking and visualization of time spent across workflow stages, helping you optimize processes and boost team efficiency.
Deep Dive with RVS Time in Status Report
RVS Softek is a trusted leader in providing advanced Jira plugins that empower teams to streamline project management and optimize workflows. Their Time in Status Report plugin stands out as a game-changer, offering in-depth insights into how issues progress through various stages, giving teams greater visibility and control.
Beyond this powerful tool, RVS Softek offers a suite of complementary solutions like:
Worklog Time Tracking & Timesheet
Agile Tools
Capacity Planner
Issue Hierarchy Structure
Issue History Report
Agile Velocity & Sprint Status Gadgets
Dashboard Charts For Jira
SLA Dashboard Gadget
RVS Time in Status Report offers a variety of key metrics, enabling teams to track and visualize project data with precision.
Metrics Included:
Time in Status
Average Time in Status
Time with Assignee
Time in Status with Assignee
Time with Assignee per Status
Time between Statuses
Status/Assignee Count
Status Transition Count
Status Transition Dates
Time in Status Per Time Range
Time with Assignee Per Time Range
Time in Status Trends Analysis
Median, 85th Percentile
Time in Field
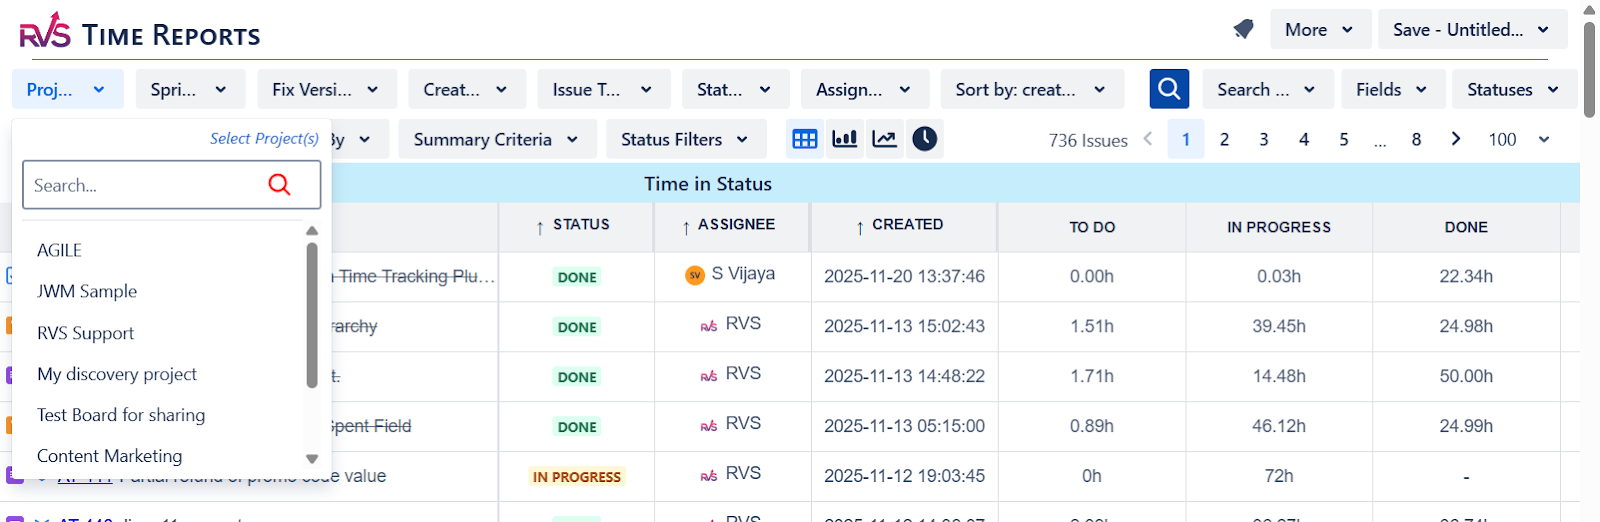
When working with Jira, this Time in Status Report plugin will help you in calculating the average duration an issue spends in specific states, such as “In Progress,” “Work Review,” or “Rework.”
By calculating the average time in each status, teams can start to make informed decisions, rather than relying on vague estimations.
This average time in status isn’t just a number; it’s a predictive metric that helps teams identify bottlenecks and inefficiencies. For example, if your team regularly experiences delays in "Code Review," you can isolate that as a key area for improvement.
Average time in status Jira not only provides insight into the health of your current workflow but also sets you up for success in 2026 by giving you a more reliable way to estimate future timelines.
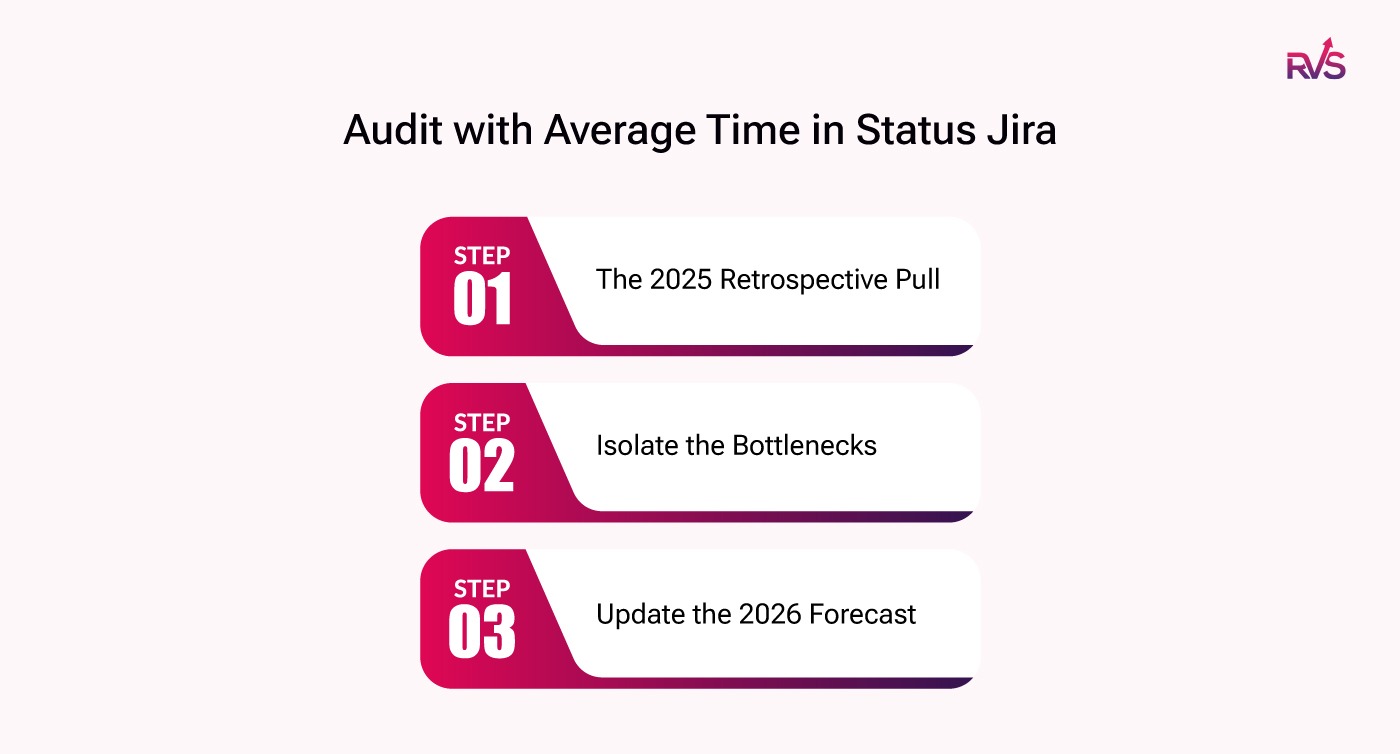
Step-by-Step Implementation: The 2026 "Clean Slate" Audit
Now that we understand the value of average time in status Jira, it’s time to implement it in a structured, strategic way. Here’s a step-by-step guide to auditing and updating your 2026 roadmap using real data.
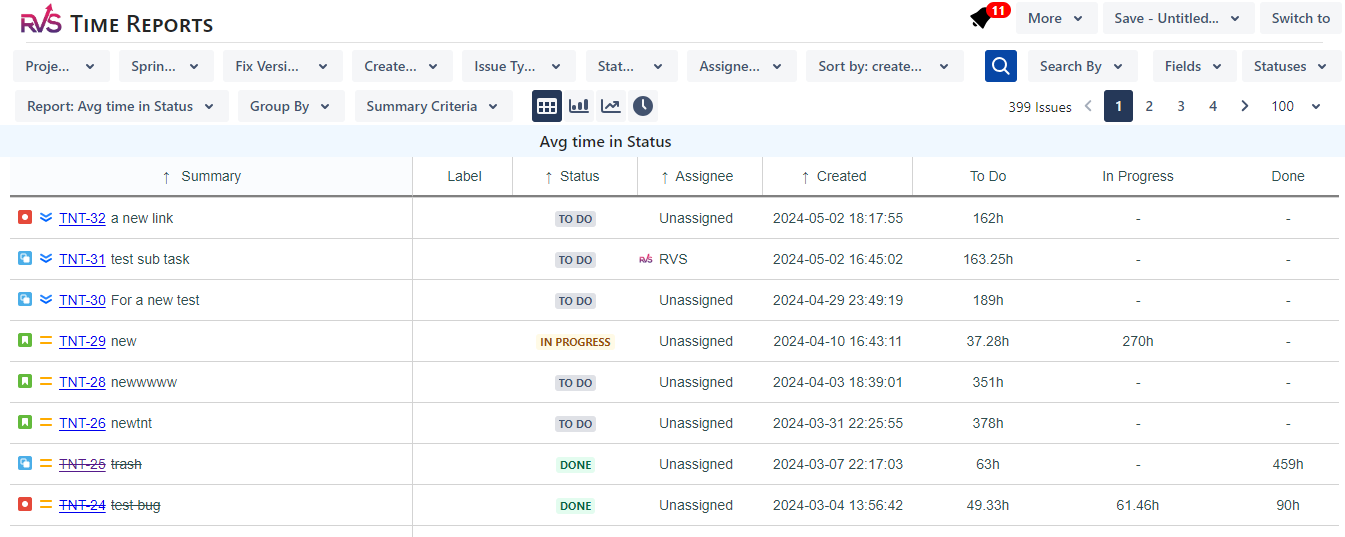
Step 1: The 2025 Retrospective Pull:
Start by running a report for all completed versions in 2025 to establish your True Average. This will be the baseline data you need to forecast your 2026 capacity and timelines.
Step 2: Isolate the Bottlenecks:
Filter by status to see where tickets spent 50% or more of their lifecycle. Is it "Testing" or "Blocked"? These are the areas that need immediate attention, as they’re hindering your team's ability to deliver efficiently.
Step 3: Update the 2026 Forecast:
Use the insights gained from the average time in status Jira to adjust your current Q1 sprint capacities and milestone dates. The 2025 data will give you more accuracy in predicting timelines for 2026.
Conclusion
The most successful Delivery Leads in 2026 won’t be the ones working the hardest; they’ll be the ones who are measuring smarter, not harder. Using the average time in status Jira, they’ll have accurate data that can predict roadblocks and set achievable deadlines.
Start 2026 with Confidence. Don’t let this year be defined by best guesses. Predictability is a choice, and it starts with knowing how long things actually take to get done. With the Time in Status Report plugin, you can set your Q1 roadmap on a solid foundation based on real-world data.
Don’t let 2026 be defined by ‘best guesses.’ Audit your 2025 averages today & set your Q1 roadmap in stone.
The Time in Status plugin for Jira is a powerful tool that tracks how long Jira issues stay in each workflow state. It helps teams monitor task progress, identify delays, and improve overall project management efficiency.
2. How does the average time in status Jira metric help project management?
The average time in status Jira metric allows teams to analyze how long tasks spend in each workflow stage, providing insights into bottlenecks, optimizing timelines, and ensuring more accurate project delivery estimates.
3. Why is tracking time in workflow stages important for Jira projects?
Tracking time in workflow stages helps teams avoid underestimating delays and ensures deadlines are realistic. This visibility into workflow progress allows for better decision-making and improves stakeholder communication.
4. What are the key benefits of using the Time in Status plugin for Jira?
The Time in Status plugin helps Jira users improve accuracy in project forecasting, reduce workflow inefficiencies, and eliminate bottlenecks, leading to more reliable timelines and better project outcomes.
5. How to predict deadlines using time in status?
By analyzing historical data on time spent in various workflow states, the Time in Status plugin for Jira provides teams with actionable insights, ensuring more reliable deadline predictions and avoiding unexpected delays.
6. Can the Time in Status plugin help identify bottlenecks in Jira workflows?
Yes, the Time in Status plugin highlights bottlenecks by tracking the time issues spend in specific states, helping teams pinpoint areas for improvement and optimize their Jira workflows for faster delivery.
7. How can I get started with the Time in Status plugin for Jira?
To get started, install the Time in Status plugin from the Atlassian Marketplace, configure it for your Jira project, and begin tracking time across workflow stages to enhance project visibility and optimize delivery timelines.
Recent Blogs
July 13, 2026
How to Create a Report in Jira That Actually Answers Your Time Tracking Question