This blog explores how RVS Time in Status Reports enhances Jira’s basic reporting by providing deeper insights into workflow inefficiencies, delays, and bottlenecks. It shows how these reports help PMOs, team leads, and developers optimize task flow and improve sprint predictability.
If you’ve ever worked with Jira, you’re probably familiar with the satisfaction of seeing a "Green" status on a task. A quick glance at your board shows everything moving through the columns as planned, providing a sense of momentum and control.
But here is the catch: A Jira status might tell you where a task is now, but it hides the history of how it got there. This is what we call the “Status-Data Trap.”
Why is it a trap?
Seeing a task move from "In Progress" to "In Review" tells you nothing about your Cycle Time—the actual time elapsed from the moment work started to the moment it was delivered. Without the context of time, you are left with a massive visibility gap that masks the true health of your project:
The Productivity Illusion: Was that task completed ahead of schedule, or has it been lagging for days behind the scenes?
The Effort Mystery: Was a transition a high-velocity, productive move, or a delayed struggle that finally crossed the line?
The Blind Spot: Standard Jira reports often provide only a surface-level "snapshot." To find the true backstory, you’re often forced to manually collect data, export CSVs, and spend hours in Excel just to see if you’re actually meeting your deadlines.
To fix this broken visibility, you need to stop looking at where a task sits and start measuring how it flows. This is where advanced Jira Status Reports become the only way to solve the problem.
While Jira provides basic reporting out of the box, it often isn't enough to capture the granular details of work velocity, and its is only possible through specialized Jira Time in Status plugins. These tools transform hidden history into actionable insights, providing the "biography" of every ticket so you can finally distinguish between real progress and simple activity.
In this blog, we are going to explore why having the right Jira status reports is the only way to fix broken visibility. We will also dive into how the Time in Status Report by RVS provides the depth needed to uncover bottlenecks, improve flow, and make more informed, data-driven decisions.
Why is the Standard Jira Status Transition Report Not Enough?
Jira offers a variety of reports that provide useful metrics for tracking the progress of your projects. Some of the basic Jira reports you’ll come across include:
Burnup Chart
Burndown Chart
Sprint Report
Cumulative Flow Diagram
Version Report
Epic Report
Epic Burndown
While these standard reports offer a broad overview of your project’s progress, they often fall short when it comes to providing the deeper insights needed to identify the root causes of delays.
For example, you might notice that your sprint is behind schedule, but without further analysis, you won’t know why. Which specific tasks are causing the lag? Are bottlenecks forming in certain areas of your workflow? Without the right tools to dive into the details, it’s nearly impossible to pinpoint these problem areas and take corrective action.
The Fragmentation Problem: The "Siloed Project" Headache
Perhaps the biggest limitation of native Jira reporting is its inability to provide a Combined Project Analysis.
In a standard Jira setup, reports are locked within the borders of a specific project. If you are a PMO overseeing three different development teams, a marketing wing, and a design squad, your workflow looks like this:
Open Project A -> Generate Report -> Take Notes.
Open Project B -> Generate Report -> Take Notes.
Repeat for Project C, D, and E.
This siloed approach makes it nearly impossible to see cross-functional bottlenecks. You can't easily compare the Cycle Time of Team A against Team B, nor can you see if a global dependency (like a shared Legal or DevOps team) is causing delays across the entire organization. You are forced to be a "data bridge," manually moving numbers from one tab to another.
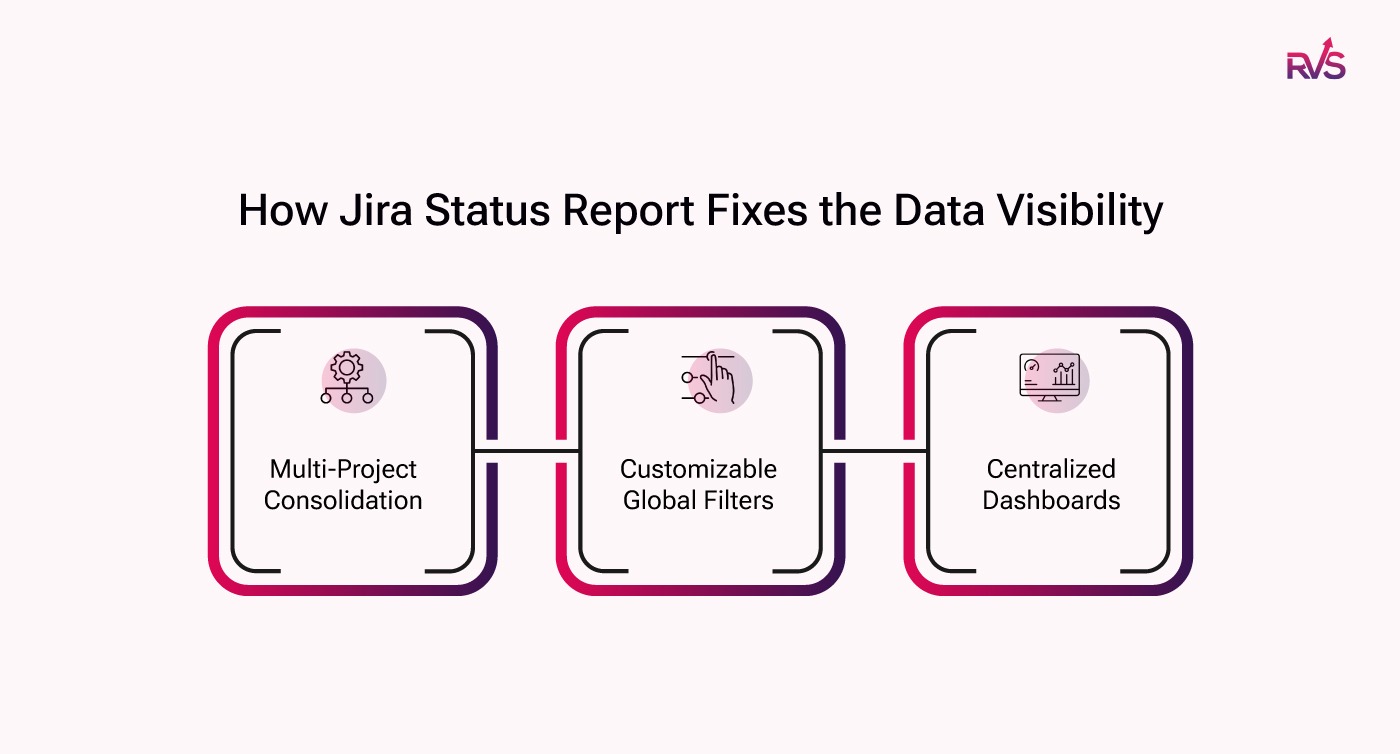
This is exactly where a specialized tool like the Time in Status Report Plugin by RVS changes the paradigm. Instead of being a prisoner to the project-by-project view, these plugins offer a unified command center for your data.
How Advanced Status Reports Solve the "Silo" Problem
Multi-Project Consolidation: With the right plugin, you can pull data from multiple projects into a single, comprehensive report. This allows for "Side-by-Side" analysis that reveals which teams are thriving and which need support.
Customizable Global Filters: Instead of repetitive manual setups, you can create complex filters once (e.g., "All active Sprints in the Mobile Department") and apply them to your status reports instantly.
Centralized Dashboards: You can bring these multi-project insights onto a single Jira Dashboard. The PMO no longer needs to "hunt" for data; the data is delivered in a formatted, ready-to-analyze view.
How RVS Time in Status Reports Helps: Unlocking True Workflow Insights
RVS Time in Status Reports provides a comprehensive view of your project’s workflow, delivering the actionable insights you need to boost efficiency and pinpoint bottlenecks. Unlike Jira’s basic reports, RVS focuses on tracking the time spent in each status, as well as the transitions between them, helping you identify exactly where your team’s processes are getting delayed. These reports give you a granular understanding of your workflow, so you can optimize every step of your project.
Here’s an overview of the reports provided by RVS Time in Status:
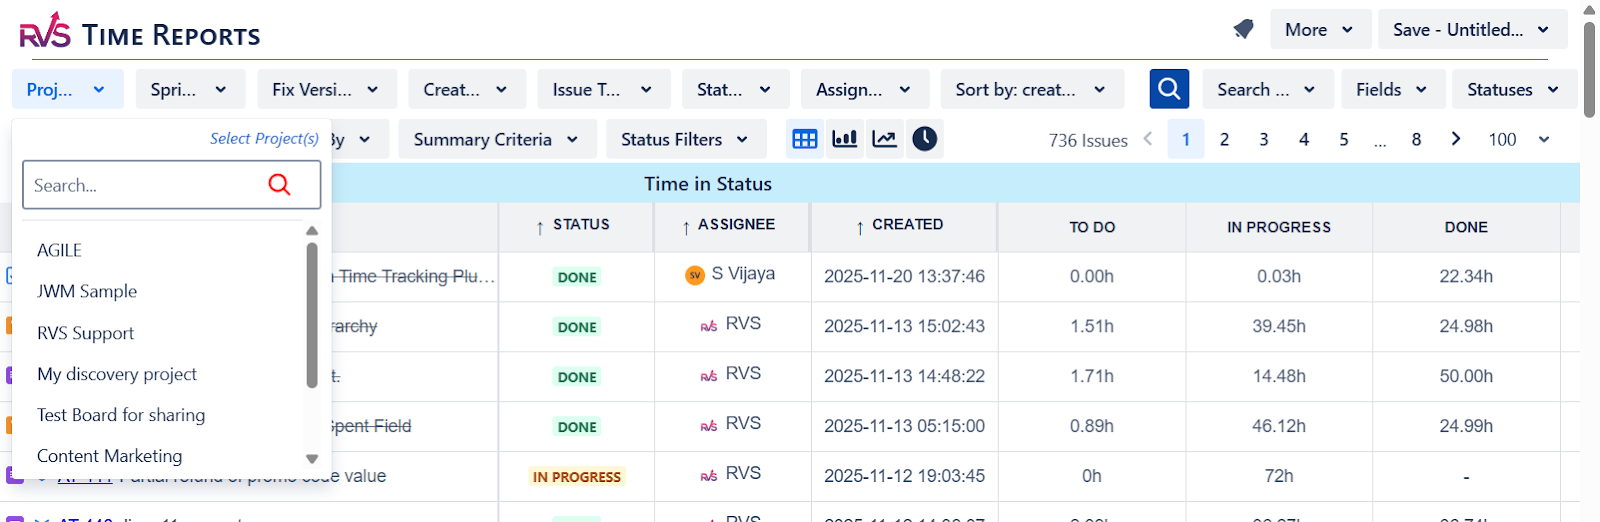
Time in Status: This is the fundamental report, showing how long each issue has been in a specific status. It helps you quickly spot if tasks are spending too much time in any given phase of the workflow, allowing you to take corrective action.
Average Time in Status: The Average Time in Status report aggregates the total time spent in each status and provides an average. This helps you understand the general pace of your project and spot any areas that need attention.
Time with Assignee: This report tracks the total time an issue spends with a specific assignee. It’s useful for monitoring individual workloads, identifying who might be overloaded, and ensuring fair task distribution.
Time in Status with Assignee This report combines the time spent in each status with the assigned team member. It gives you insights into how long a task has been sitting with an individual, which can reveal whether the assignee is facing challenges or bottlenecks in their workflow.
Time with Assignee per Status: This report breaks down how much time each team member has spent in every status. It helps identify which statuses may be causing delays for specific assignees and gives a clearer picture of where issues are slowing down.
Time Between Statuses: The Time Between Statuses report tracks the amount of time an issue spends transitioning from one status to the next. This helps identify where the workflow might be slowing down during status transitions and whether there are unnecessary delays.
Status/Assignee Count: This report provides a count of how many times an issue has been in each status, helping you spot repetitive cycles where tasks may be bouncing between statuses without making real progress.
Status Transition Count: This report tracks how many times an issue transitions between different statuses. It’s ideal for identifying "ping-pong" issues, where tasks are continuously moving between statuses instead of progressing forward.
Status Transition Dates: This report shows the exact dates and times when an issue transitioned between statuses, helping you identify any delays in handoffs or transitions that may be causing bottlenecks.
Time in Status Per Time Range: The Time in Status Per Time Range report allows you to see how long tasks have been in a specific status over a defined time range, giving you deeper insight into how delays evolve over time.
Time with Assignee Per Time Range: Similar to the above, this report tracks the time each assignee spends on tasks within a specific time range, making it easier to track progress and identify periods of overwork or idle time.
Time in Status Trends Analysis: This report shows trends over time, helping you analyze whether the time spent in each status is improving or worsening. It’s an essential tool for identifying long-term inefficiencies and tracking the impact of workflow optimizations.
Median, 85th Percentile: This report allows you to analyze the distribution of time spent in statuses, giving you insight into outliers and the general flow of your tasks. By looking at the median and the 85th percentile, you can get a more nuanced view of your workflow.
Time in Field: The Time in Field report tracks how long tasks spend in custom fields, helping you monitor any fields that may be slowing down the overall process.
How Time in Status Reports Serves Every Stakeholder?
With RVS Time in Status Reports, every stakeholder can gain the specific insights they need to monitor and optimize workflows. By providing precise, real-time data, RVS ensures that teams can act on the right information at the right time, allowing them to improve productivity, identify bottlenecks, and enhance project efficiency. Here’s how RVS Time in Status Reports empowers different roles:
For the PMO: High-Level Insights (Efficiency & Governance)
Average Time in Status: This report provides the PMO with an overview of how long issues are staying in each status. Tracking average time spent, it helps assess the overall health of the project and identify potential bottlenecks.
Status Transition Count: PMOs can use this report to see how often issues transition between different statuses. It helps identify whether tasks are moving smoothly or if they’re bouncing between statuses without making significant progress.
Status/Assignee Count: This report tracks how many times issues have been in each status, helping PMOs spot any repetitive cycles or stalled tasks, which can indicate issues that need addressing at a governance level.
Time Between Statuses: The Time Between Statuses report helps PMOs understand how long issues stay between specific transitions, giving them insight into where delays may be occurring in the workflow.
For Team Leads: Detailed Monitoring of Flow & Blockers
Time with Assignee: Team leads can use this report to understand how long issues have been assigned to each team member. It helps identify team members who may be overloaded and tasks that require more attention.
Time in Status with Assignee: This report provides an overview of how long each assignee has spent in each status. It’s crucial for team leads to monitor individual team members' productivity and identify where bottlenecks might occur.
Time with Assignee Per Status: This report provides insight into how long each team member has spent in each status, allowing team leads to see if particular tasks or statuses are causing delays for specific individuals.
For Developers/Team Members: Self-Correction Insights
Time in Status Per Time Range: Developers and team members can track the time their tasks spend in each status over a defined time range. This helps them spot inefficiencies and areas where their tasks are lingering for too long.
Time with Assignee Per Time Range: This report helps developers see how much time they’ve spent with specific issues over a certain period, enabling them to identify tasks that might need more focus or attention.
Conclusion
Inaccurate tracking of status transitions can limit your team’s ability to predict sprint outcomes and optimize workflow efficiency. With the right tools, like the Time in Status Report by RVS, teams can gain valuable insights into project performance. By identifying where delays and bottlenecks occur, and understanding resource inefficiencies, teams can make informed decisions to improve planning, forecasting, and task flow. These reports go beyond time tracking—they help drive actionable improvements for better sprint outcomes.
Ready to enhance your sprint predictability and workflow efficiency?
To create a status report in Jira, navigate to your project, go to the "Reports" section, select the type of report you need, and apply the relevant filters like project, sprint, or assignee to customize the report.
2. What are the three types of reports in Jira?
The three main types of reports in Jira are:
1. Burndown Chart: Tracks the remaining work in a sprint.
2. Sprint Report: Summarizes the work completed and the work remaining in a sprint.
3. Cumulative Flow Diagram: Shows the progress of issues through different workflow statuses.
3. What is P1, P2, P3, P4 in Jira?
P1, P2, P3, and P4 are priority levels used in Jira to categorize issues.
P1 (Priority 1): Critical issues that require immediate attention.
P2 (Priority 2): Important issues that should be resolved soon.
P3 (Priority 3): Standard priority, non-urgent issues.
P4 (Priority 4): Low-priority issues that can be addressed later.
4. How can Jira status reports help identify bottlenecks in my workflow?
Jira status reports help you track the time tasks spend in each status, making it easy to identify where bottlenecks occur. For instance, if tasks are spending too much time in a particular status, it indicates that the area needs attention, whether it’s due to dependencies, resource constraints, or communication issues.
5. Can I customize Jira status reports?
Yes, Jira allows for some customization of status reports, such as filtering by assignee, project, or sprint. For more advanced features, like custom status groupings or excluding weekends from time calculations, third-party plugins like RVS Time in Status can be used.
6. What is the "Time in Status" report in Jira?
The "Time in Status" report tracks how long each issue stays in a particular status, helping you monitor the flow of tasks, spot inefficiencies, and make data-driven decisions to improve team productivity and
7. How do I see all statuses in Jira?
To see all statuses in Jira, go to your project's board or workflow settings. In the board view, you can see the different statuses for each column. In the workflow settings, you can view and edit the full list of statuses available in your project.
Recent Blogs
July 9, 2026
Best Jira Time Tracking Apps to Boost Team Productivity (2026)