The Problem: Jira shows progress but not where issues get stuck; sprint velocity alone hides real workflow delays.
The Shift: QA leads move beyond velocity metrics to analyze status transitions and detect hidden bottlenecks.
The Fix: Use Time in Status Report by RVS Softek to track handoff delays, reopen cycles, slow approvals, and stabilize release cycles before sprint deadlines.
As a Project manager, you need to know not just what your team is working on, but how long things are taking, where work is piling up, and whether your delivery timelines are realistic, all in real time.
Jira, as a project management platform, gives you a powerful foundation to track all of this. And when you pair it with the right Jira time tracking reports, that foundation becomes a genuine competitive advantage for how your team plans, delivers, and improves.
This guide walks through what Jira time tracking actually covers, what's available natively, and the six most important Jira time tracking report types every project manager should know, along with the plugin that makes all of them accessible in one place.
What Is a Jira Time Tracking Report?
A Jira time tracking report is a data view that measures how long issues spend at different stages of your workflow. Rather than showing you the current state of your board, it looks at the history of your issues, specifically the timestamped record of every status transition Jira captures automatically as your team works.
This gives project managers a clear, quantified picture of:
How long do individual issues spend in each workflow status (In Progress, In Review, Blocked, QA, Done, etc)
How long does the team take on average to move work through each stage
How delivery times are trending over weeks or months
Which team members are holding work, and for how long
How long does it take to get from one status to another, end to end
These are the numbers behind the decisions every project manager makes:
Sprint planning
Deadline commitments
Retrospective conversations
Stakeholder updates.
Without a Jira time tracking report, those decisions are based on judgment and experience. With one, they're grounded in actual data from your team's real workflow.
What Native Jira Time Tracking Looks Like
Jira's built-in time tracking is a solid foundation for any project management team. It's designed to capture effort data naturally as your team works, no extra process required.
What Native Jira Covers:
Time estimates and logging: Team members set original estimates on issues, log work hours manually, and update remaining time as they progress
Time Tracking Report: Compares original estimates against actual logged time across a sprint or version; useful for tracking billable hours and effort budgets
Burndown Chart: Shows remaining work in a sprint against the ideal burndown line
Velocity Chart: Tracks how much work the team completes in each sprint over time
Sprint Report: Summarizes completed and incomplete work at the end of each sprint
These reports give project managers a clean, integrated view of sprint health and effort actuals, all powered by the data your team generates day-to-day.
Going Deeper with a Jira Time Tracking Plugin
With the right plugin, you can build significantly on top of Jira's native foundation, unlocking status-level time analysis, cross-sprint trend views, assignee-level breakdowns, and cycle time reporting that surfaces how long behind every workflow stage.
Time in Status Reportsby RVS Softek is purpose-built for exactly this. Available on the Atlassian Marketplace, it works directly inside your Jira instance and gives project managers access to 13+ report types based on the workflow history Jira already captures, all calculated on your configured working calendar, with flexible filters across sprint, project, assignee, issue type, date range, and more. No external tools. No exports. No additional data handling.
6 Jira Time Tracking Reports Every Project Manager Needs
1. Time in Status Report: Know Exactly Where Every Issue Stands
The Time in Status Report shows the total time each issue spent in every workflow status across its lifecycle. For every issue in your filtered set, you get a complete, status-by-status time breakdown, so you can see at a glance whether a ticket moved quickly through development but stalled in review, or whether it's been sitting in QA far longer than expected.
When to use it:
Delays & Bottleneck: The time in status report will tell you in which status it was delayed and help solve the bottleneck.
Pre-retrospective Preparation: filter to your completed sprint and see which statuses consumed the most collective time across all issues
SLA Monitoring: check whether critical issue types are consistently exceeding expected time thresholds in specific stages
2. Average Time in Status: Benchmark Your Team's Workflow Health
Where the Time in Status Report shows you individual issue data, the Average Time in Status Report aggregates it. This Jira time tracking report calculates the average time issues are spent in each status across your entire filtered set, giving you a team-level or project-level benchmark for how long each stage of your workflow typically takes.
When to use it:
Weekly or monthly process reviews: "Our average time in Code Review was 2.4 days this sprint. Was it better last month?"
Setting realistic sprint commitments: Average status durations give your estimates a factual basis rather than a hopeful one
Cross-Team Performance: Comparing workflow performance across teams or projects running similar work types
3. Time in Status Per Time Grain: Track Whether Your Process Is Actually Improving
The Time in Status Per Time Grain report shows total status time within a defined date range, grouped by Days, Weeks, or Months. It's the historic trend view in your Jira time tracking report toolkit, the one that answers whether your workflow improvements are working, or whether things are quietly getting slower.
When to use it:
Time Progress after a change: Did time in In Progress actually drop after you introduced a clearer Definition of Ready?
Quarterly Reporting: show leadership how delivery velocity has trended over time, not just what the current sprint looks like
Seasonal Changes: Identifying seasonal patterns in delivery time that recur predictably across your project calendar
4. Time between Status Transitions: Measure Your Real Delivery Time
The Time between Status Transitions report measures how long issues take to move from one specific status to another. You define both the start and end status, and the report calculates that end-to-end duration across all filtered issues.
This is the cycle time report in Jira that project managers need for reliable delivery forecasting. Set the window from In Progress to Done, and you have true cycle time, the cleanest single metric for how predictably your team delivers. Extend it from ticket creation to Done, and you have lead time, the full customer-facing delivery duration.
When to use it:
Sprint planning: Historic cycle time data makes your sprint commitments grounded in reality, not optimism
Measuring handoff delays between teams: Run the report from In Review to In QA to see how long issues wait between team handoffs
Identifying delivery variance: If some issues take two days and others take fourteen, your sprint commitments are unreliable, regardless of average performance
5. Time with Assignee: See Who Is Holding Work and for How Long
The Time with Assignee report shows the total time each issue spent with each assignee during its lifecycle. If an issue was reassigned at any point, the time is split accurately across every assignee who held it, giving project managers a clear picture of how work moves between people, not just between statuses.
When to use it:
Workload Balancing: Are certain team members consistently holding issues significantly longer than others?
Understanding Reassignment Patterns: Where in the workflow are issues getting handed off, and how much time does each handoff add?
Capacity Planning: Informing capacity planning for the next sprint based on actual assignee throughput data
6. Time in Status per Assignee: Separate Systemic Problems from Individual Ones
The Time in Status per Assignee report combines both dimensions, showing how long each issue spent in each specific status, broken down by who held the issue at that point. It's the intersection view that helps project managers distinguish between a workflow problem affecting everyone and a pattern specific to one person or role.
When to use it:
Team or Individual Problem: Retrospectives where you want data, not guesswork, to understand whether a bottleneck is team-wide or concentrated in one area
Role-based Analysis: Are senior engineers getting issues stuck in approval stages more than others? That points to a process dependency, not a performance issue
Comparing workflow behavior across team members who work on similar issue types
Quick Reference: Which Report for Which Situation
PM Situation
Best Report
Explaining why a specific ticket is delayed
Time in Status Report
Weekly workflow health check
Average Time in Status
Proving a process change worked
Time in Status per Time Grain
Building reliable sprint estimates
Time between Status Transitions
Reviewing workload distribution
Time with Assignee
Diagnosing a repeated bottleneck
Time in Status per Assignee
How Time in Status Reports Benefits Project Managers
Every report in this list is available inside RVS Softek's Time in Status Reports plugin, and together, they give project managers a level of workflow visibility that transforms how you plan, communicate, and improve delivery.
Here's what that looks like in practice:
Better sprint planning: When you know your team's average cycle time and status durations from the last three sprints, your sprint commitments stop being optimistic guesses and start being data-backed forecasts.
Faster stakeholder answers: When a delivery date slips, you can open a Jira time tracking report, find exactly which status caused the delay, and walk into that conversation with a clear, factual explanation, not an apology.
Cleaner retrospectives: Instead of "it felt like QA was slow this sprint," you can show the team that QA averaged 3.1 days per issue, up from 1.8 days last sprint, and open a focused conversation about why.
Visible trends over time: The Time in Status Per Time Grain report lets you track whether your process improvements are actually working across weeks and months, not just sprint to sprint.
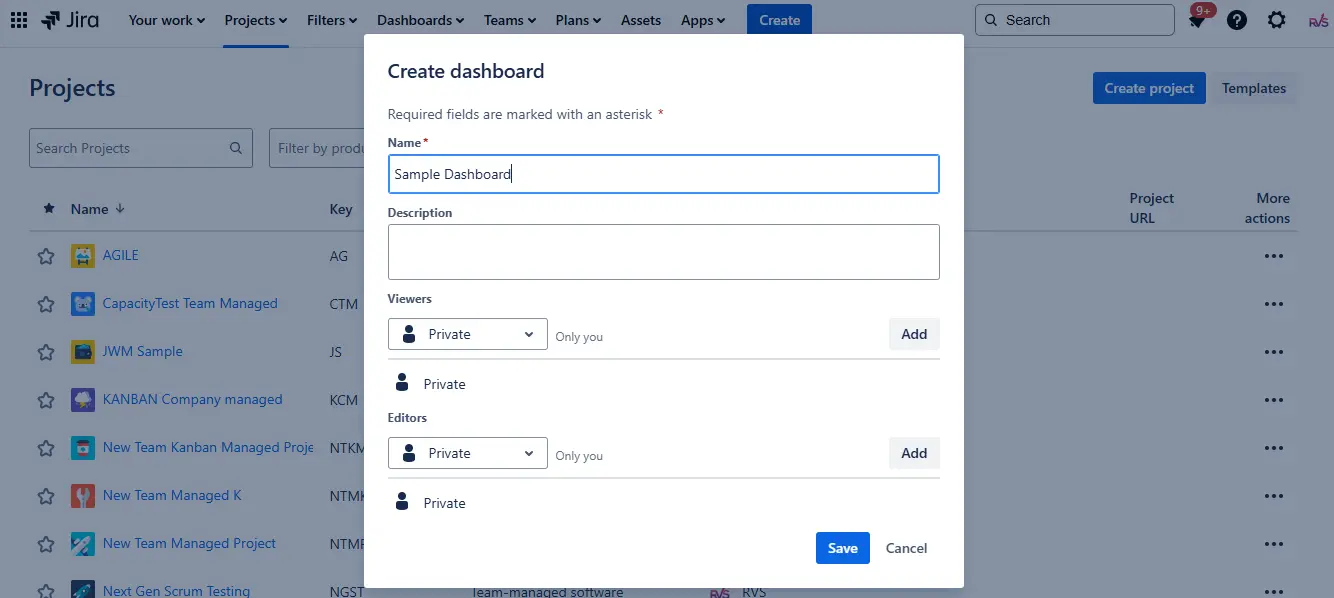
How to Set Up Time in Status Visual Dashboard in Jira?
A live visual dashboard. The plugin includes a Time in Status Gadget that project managers can add directly to any Jira dashboard. Follow these steps:
Go to your Jira Dashboard → Add Gadget → search "RVS" → select the Time Reports Gadget.
Configure it with your sprint or project filter, and your key workflow metrics are visible every morning without opening a single report screen. For teams managing multiple projects, you can add multiple gadgets to one dashboard, each scoped to a different team or sprint, creating a complete Jira time in status visual dashboard in one view.
All of this works on both Jira Cloud and Jira Data Center. All data stays within your Jira instance, no external exports, no third-party data handling.
For project managers who want to lead with data rather than instinct, the Time in Status Reports plugin is the most direct upgrade to your Jira workflow analytics toolkit.
Conclusion
Mastering Jira time tracking is key to turning workflow data into actionable insights. With RVS Softek’s Time in Status Reports, project managers gain complete visibility into issue progress, bottlenecks, and team performance, empowering smarter planning, faster decisions, and smoother sprints.
Frequently asked questions
What is the Time in Status Report in Jira?
It’s a detailed report that tracks how long each issue spends in every workflow status, helping teams identify delays and bottlenecks quickly.
How can an office or project manager benefit from RVS Softek’s plugin?
Managers get clear insights into issue progress, team performance, and workflow inefficiencies, enabling faster decision-making and improved sprint planning.
Can this plugin track delays for specific team members?
Yes, the Time in Status per Assignee report shows exactly who held an issue and for how long, helping pinpoint bottlenecks at the individual level.
Does it help improve QA and review processes?
Absolutely. By highlighting stages with prolonged durations, the plugin lets QA leads streamline testing, reduce delays, and improve overall workflow efficiency.
Can RVS Softek Time in Status Reports work across multiple Jira projects?
Yes, it supports cross-project reporting, giving managers a holistic view of team performance and workflow health across all projects.
How does time in status reports integrate with Jira dashboards?
You can add the Time in Status Gadget directly to any Jira dashboard, displaying real-time metrics like status durations, bottlenecks, and sprint performance at a glance.
Will using time in status report improve sprint planning and retrospectives?
Yes, with precise data on cycle times, delays, and workflow patterns, managers can set realistic sprint goals, run effective retrospectives, and enhance team productivity.
Recent Blogs
July 23, 2026
Jira Time in Status Report: Complete Guide for Project Managers